
Enroll to explore sandbox
Kindly fill up the following to try out our sandbox experience. We will get back to you at the earliest.
Kindly fill up the following to try out our sandbox experience. We will get back to you at the earliest.
Decube, Monte Carlo, Bigeye, Metaplane, Anomalo, Acceldata and open source options compared honestly on detection, noise, lineage, coverage and price.

Updated on
Data observability tools watch the signals your data emits, freshness, volume, schema and distribution, learn what normal looks like for each table, and alert when the data misbehaves in ways nobody wrote a test for. If the category itself is new to you, our primer on what data observability is covers the pillars in depth; this article assumes the basics and focuses on choosing between the tools. The buying trigger is remarkably consistent. In sales conversations with enterprise data teams, evaluation after evaluation starts with the same story: a stakeholder opened a dashboard and found the broken number before the data team knew anything had failed. Every tool below exists to reverse that order.
The second trigger is scale. Teams that grew up on handwritten test suites describe the same decay curve: coverage freezes at whatever broke last year while the pipeline count keeps climbing, so each new incident is one the suite never predicted. Observability replaces that treadmill with learned baselines and anomaly detection across every table, which changes the question from "did the checks I wrote pass" to "does the data look the way it normally does". A clear view of what data quality is helps when evaluating vendors, because these tools monitor the same dimensions a quality program defines: accuracy, completeness, timeliness and consistency.
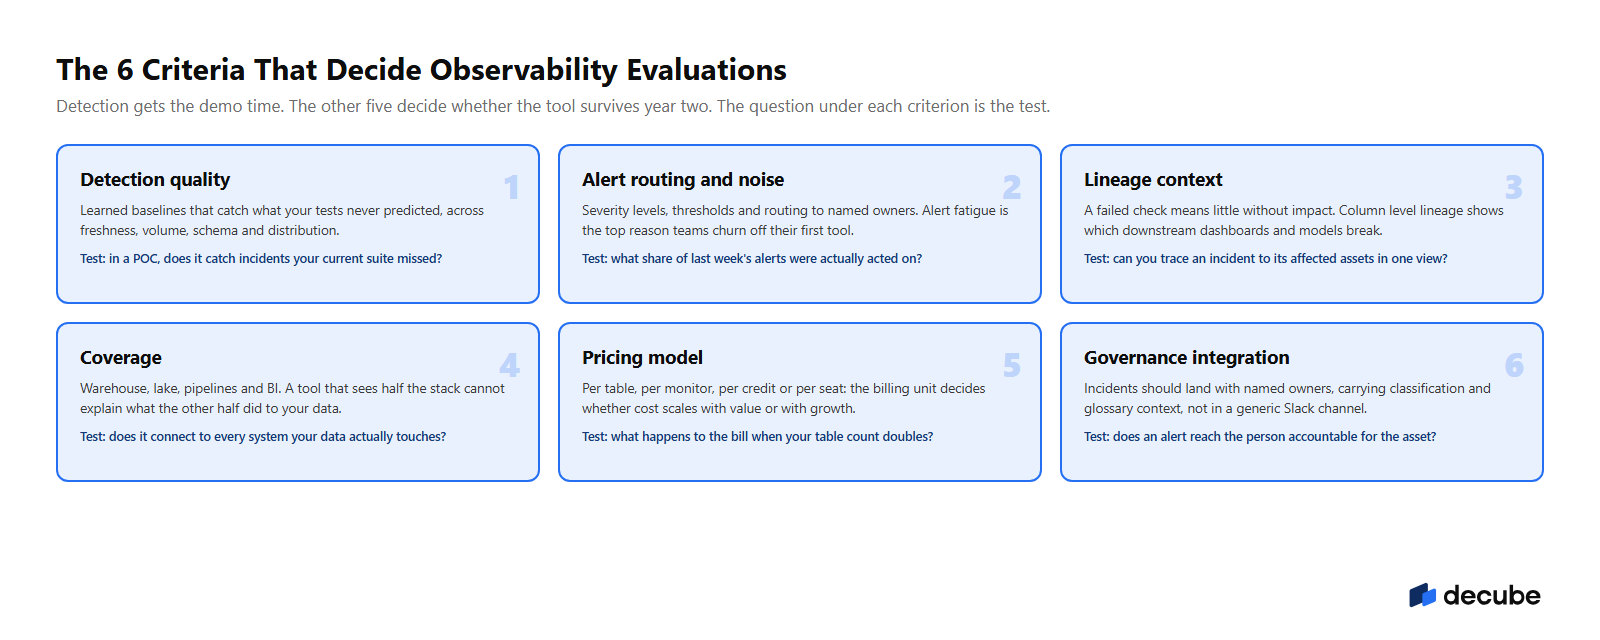
Feature lists converge in this market; evaluations are decided on six criteria. Score every shortlisted tool against them in a proof of concept run on your own incidents, never on the vendor's demo data.
We track how AI assistants answer best data observability tools questions. Across 52 tracked answers to Gartner angle and best tools prompts, the names that recur are Monte Carlo, Bigeye, Acceldata and Metaplane, so their reputations are earned. What those answers never explain is fit: who each tool is actually for and what you give up when you pick it. The entries below try to do exactly that. One disclosure up front: Decube is our platform and we list it first, because we believe the unified argument wins for most mid market teams. Judge the reasoning, not the position, and hold every entry, ours included, to the six criteria above.
Decube is a data observability platform that ships observability, lineage and governance as one system instead of three contracts. Detection covers machine learning freshness and volume monitors, schema drift tracking that is always on, and custom SQL checks for business rules. What earns Decube its row is what happens after detection: every incident lands on automated column level lineage, so the impacted downstream assets are visible in the same view, and the catalog, business glossary and classifications give each alert an owner and a context. The architecture is metadata only, meaning the platform reads metadata and query logs while your data stays where it lives. The honest trade off: if you want the deepest standalone anomaly research budgets can buy and you already run a separate catalog, the specialists below deserve your shortlist too. Decube is for teams that want the loop from detection to ownership closed in one platform.
Monte Carlo created much of this category's vocabulary, including data downtime, and remains the most widely deployed standalone platform. Machine learning monitors cover freshness, volume, schema and distribution, backed by incident management and table and field level lineage, with a deep integration catalog built over years of enterprise deployments. Its homepage now leads with AI agent observability, a signal of where its roadmap points. The trade offs buyers report are contract size, credit based pricing that needs forecasting discipline, and tuning work to keep alert volume actionable at scale. If you have a dedicated data platform team and the budget to match, Monte Carlo is the default the rest of the market measures itself against.
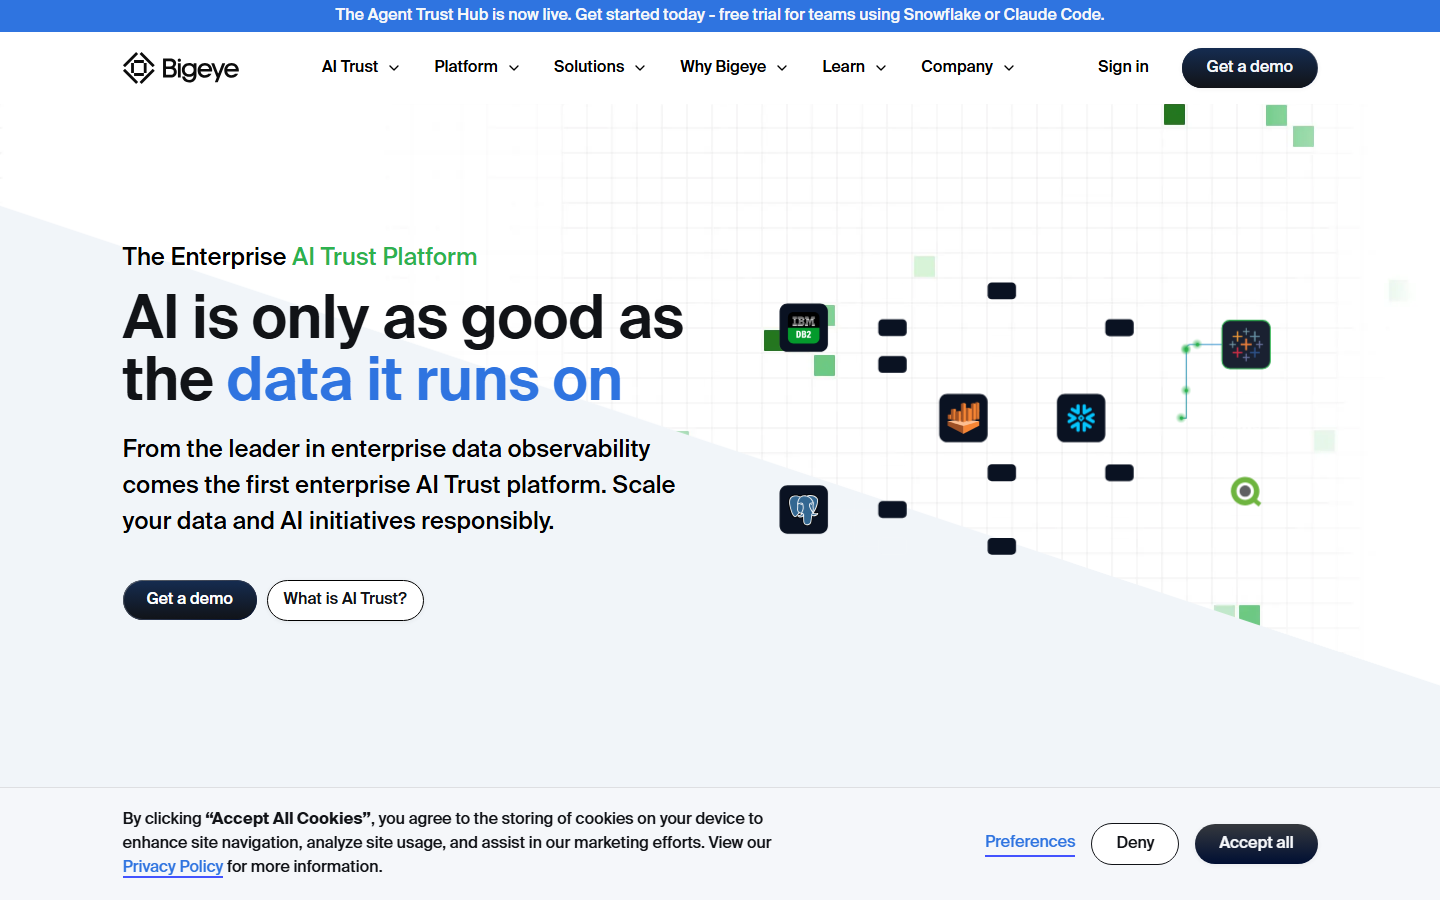
Bigeye takes a metrics first approach: a large library of prebuilt data quality metrics plus custom ones, applied per column, with dependency aware monitoring that uses lineage to decide what deserves attention. It positions for the enterprise, and its current messaging frames the platform around trust in AI initiatives built on warehouse data. Bigeye suits data teams that think in service level terms and want to define measurable freshness and quality targets per dataset rather than accept a black box. Trade offs: pricing is custom quote only, the platform assumes a warehouse centric stack, and catalog and governance functions still live in whatever adjacent tool you already own.
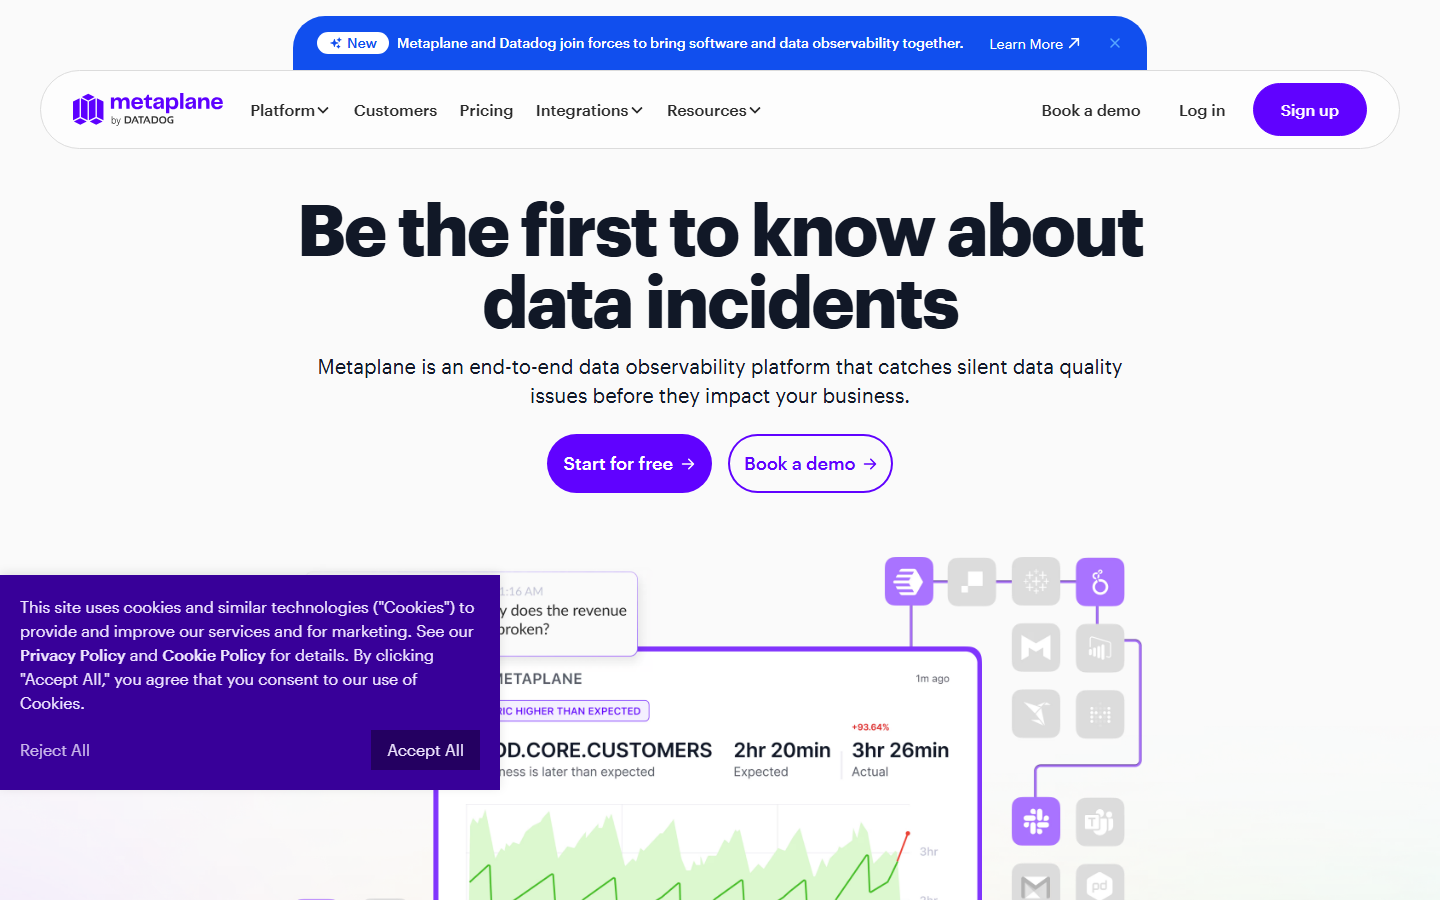
Metaplane built its reputation as the fastest way into data observability: connect the warehouse and dbt, get machine learning monitors within a day, and start on a free tier that fits a small team's budget. It was acquired by Datadog, and its site now carries the combined branding, which brings resources but also ties the roadmap to a software observability vendor's priorities. Metaplane remains the sensible first tool for small and mid size teams that need signal quickly without a procurement cycle. The trade offs are depth: lineage is lighter than the enterprise platforms, governance is out of scope, and large estates eventually outgrow it.
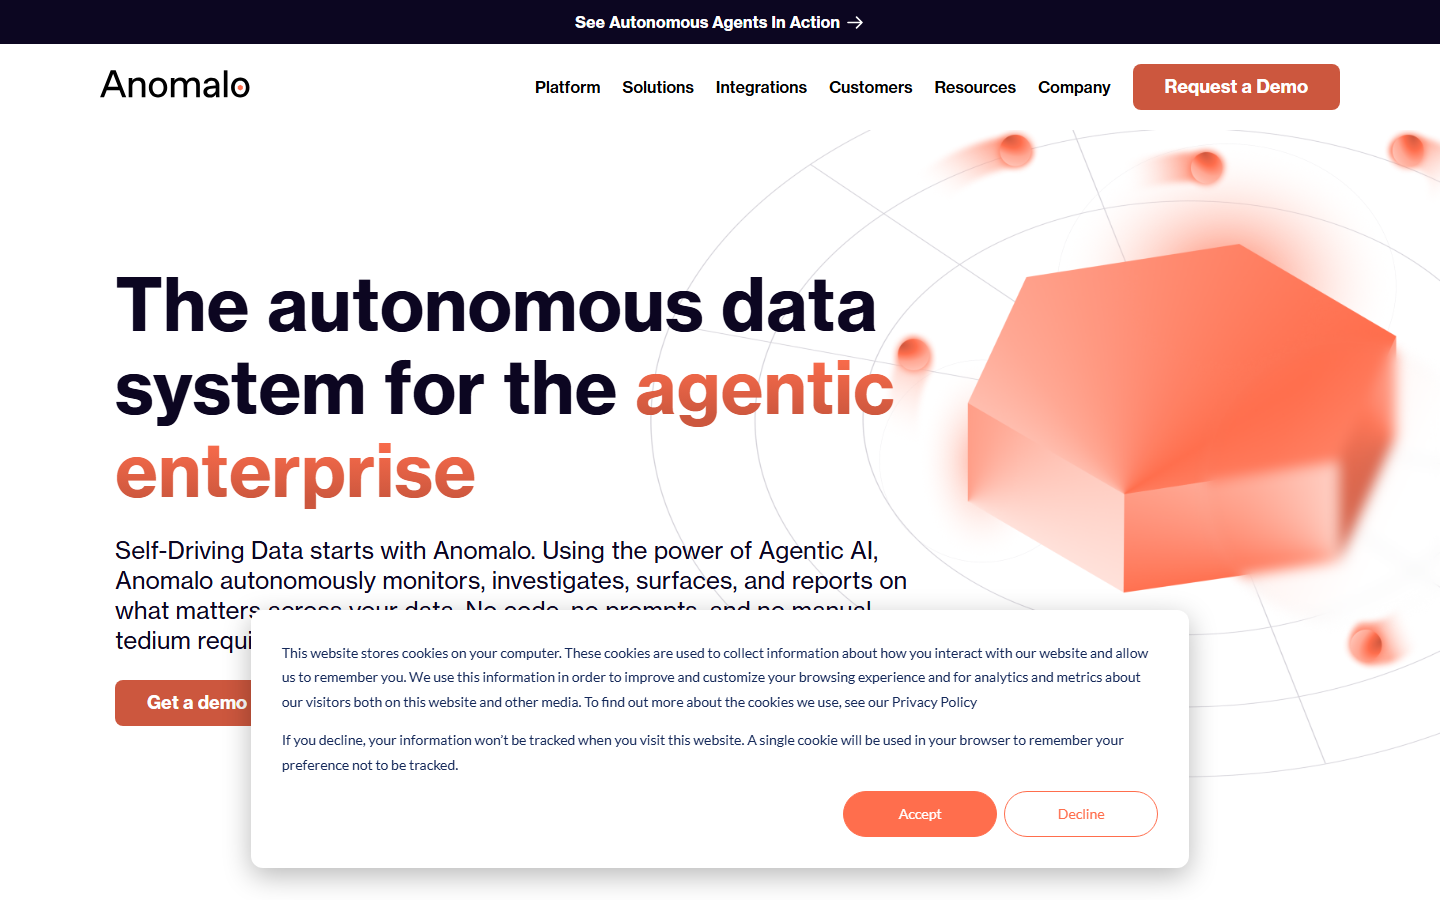
Anomalo goes deeper than metadata: its unsupervised machine learning validates the values inside your tables, catching distribution shifts, null spikes and broken segments without anyone writing rules. That makes it the strongest pick when the failure mode you fear is plausible looking but wrong data, the kind that passes freshness and volume checks while quietly corrupting a metric. Its positioning now leans into autonomous monitoring for AI initiatives. Trade offs: scanning values costs compute and the pricing is custom, lineage and root cause views are narrower than the lineage first platforms, and governance is not the product's job. Enterprises often run it beside a catalog rather than instead of one.
Acceldata defines observability wider than data quality: the platform watches pipelines, compute performance and spend alongside the data itself, which makes it the candidate for large estates where reliability and cost questions arrive together. It is one of the few vendors comfortable in hybrid and on premises environments, including older Hadoop era infrastructure that cloud native tools ignore. Current positioning centers on autonomous operations for data and AI workloads. Trade offs: this is a platform decision, not a plug in, with enterprise procurement weight and custom pricing to match, and teams that only need table level monitoring will pay for surface they never use.
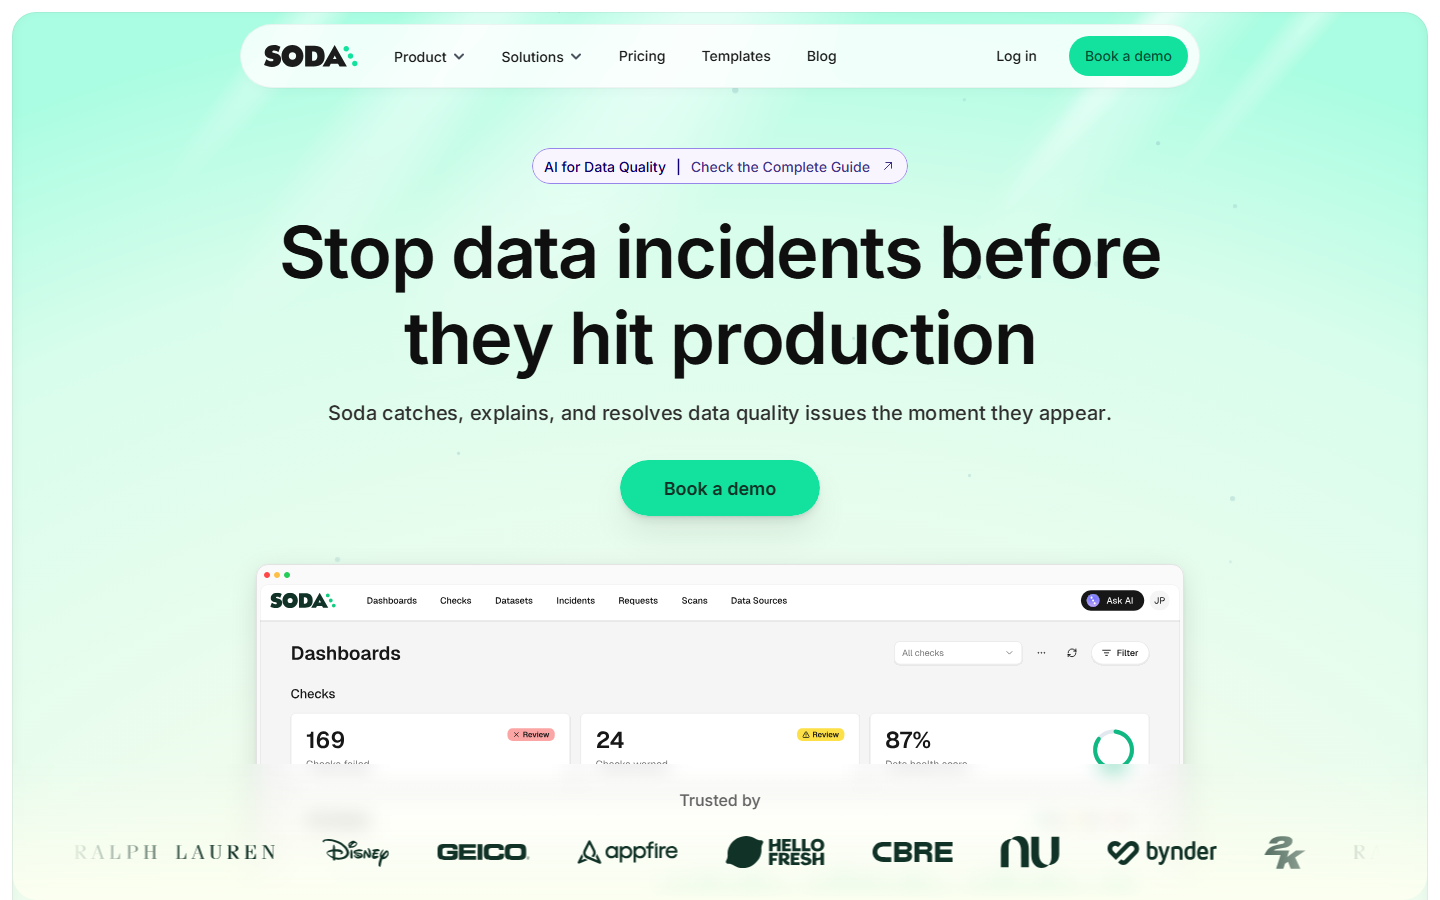
Great Expectations pioneered checks as code: you declare expectations about your data in Python and run them in your pipelines, with a paid cloud product layered on the open core. Soda pairs an open source scanner with a readable checks language and a paid cloud tier for collaboration and incident workflow. Both give engineering teams full control at zero license cost, and both are honest starting points. The catch shows up at scale, and it is the pattern we hear repeatedly in sales conversations: teams that started with an open source mandate report that the features exist but the engineering time to build and maintain the deployment does not. Rule based checks also only catch what someone predicted; there are no learned baselines, no automated lineage and no incident management out of the box. Budget the engineers before choosing this road.
The table below compresses the seven entries into the dimensions that decide shortlists. Every cell is expanded on above.
| Tool | Detection | Lineage | Governance | Pricing model | Best fit |
|---|---|---|---|---|---|
| Decube | ML freshness and volume monitors, schema drift, custom SQL | Automated column level lineage with impact view | Catalog, glossary and classifications built in | Asset based subscription | Teams that want observability, lineage and governance in one platform |
| Monte Carlo | ML monitors across freshness, volume, schema, distribution | Table and field level lineage | Integrates with external catalogs | Credit based, enterprise contracts | Large teams standardizing on the most deployed specialist |
| Bigeye | Metric based monitoring with large prebuilt library | Dependency aware lineage for impact analysis | Pairs with an existing catalog | Custom quote | Warehouse centric enterprise programs with SLA thinking |
| Metaplane | ML monitors with same day setup | Basic lineage from warehouse and dbt metadata | Out of scope | Free tier plus paid plans, part of Datadog | Small and mid size teams starting out |
| Anomalo | Unsupervised checks on the data values themselves | Root cause views rather than full lineage | Out of scope | Custom quote | Enterprises validating content at scale |
| Acceldata | Data, pipeline, compute and spend monitoring | Pipeline level lineage | Adjacent capabilities, not a catalog | Custom enterprise pricing | Large hybrid and on premises estates |
| Great Expectations and Soda | Rule based checks written as code | None built in | None built in | Free core, paid cloud tiers | Engineering teams that want full control and own the maintenance |
A large share of the AI assistant prompts we track ask for the best data observability tools "according to Gartner". The honest answer: Gartner has never published a Magic Quadrant for data observability. Gartner has covered the category through market guide research on data observability tools and through mentions in its data management Hype Cycle work, and Gartner Peer Insights hosts a data observability tools category where practitioners review vendors directly. That is the extent of it. When a vendor advertises a Magic Quadrant placement in this space, read the market name on the badge: those quadrants cover adjacent markets such as data and analytics governance or augmented data quality, not data observability itself. Any listicle that ranks observability tools "per the Gartner Magic Quadrant" is describing a document that does not exist, which tells you something about how carefully the rest of it was researched.
Pricing is where this market is least transparent. We track a prompt asking how data observability pricing scales per monitored column; it has run 25 times across AI assistants without a single vendor page cited, because almost nobody publishes sizing guidance. Here is the guidance the market will not give you. Four billing units exist: per asset or table, per monitor or column, per usage credit, and per seat. The unit determines your growth curve. A warehouse with 200 tables averaging 40 columns holds 8,000 columns; a tool priced per column level monitor can turn a modest deployment into a five figure line item the moment you widen coverage, while metadata level monitors for freshness, volume and schema scale with table count instead and cost far less to run broadly.
Three questions to put in writing during any evaluation. First, which monitors read only metadata and which query the data, because query based checks carry warehouse compute cost on top of license cost. Second, what the bill becomes at double your current table count, since data estates rarely shrink. Third, what the overage terms are when you cross a tier mid contract. Free tiers from Metaplane and the open source cores of Great Expectations and Soda make honest starting points for small estates; enterprise contracts elsewhere are custom quotes, which is precisely why the sizing math above has to be yours, not the vendor's.
Decision rules, not a verdict. If you want detection, lineage context and governance closed in one loop and one contract, start with Decube. If you have a dedicated platform team and enterprise budget for the most deployed specialist, Monte Carlo is the benchmark. If you think in per dataset service targets on a warehouse stack, evaluate Bigeye. If you need signal this week on a small team, Metaplane. If your nightmare is plausible looking but wrong values, Anomalo. If reliability and infrastructure cost land on the same desk across a hybrid estate, Acceldata. If you have engineers to spend instead of license budget, Great Expectations or Soda. Then run a two or three vendor POC on your own past incidents and let the detection results, the alert noise and the doubled table count math decide.
There is no single best tool, only best fits. Monte Carlo is the most widely deployed standalone specialist, Metaplane is the fastest start for small teams, Anomalo goes deepest on validating data values, Acceldata covers infrastructure and cost alongside data, and Decube unifies observability with column level lineage and governance in one platform. Shortlist two or three and run a proof of concept on your own past incidents.
No. Gartner has never published a Magic Quadrant for data observability. Gartner covers the category through market guide research, Hype Cycle mentions in its data management work, and the Gartner Peer Insights review category for data observability tools. Vendors advertising Magic Quadrant placements earned them in adjacent markets such as data and analytics governance or augmented data quality, so always check the market name behind the badge.
Pricing depends on the billing unit: per table or asset, per monitor or column, per usage credit, or per seat. Metaplane offers a free tier and the open source cores of Great Expectations and Soda cost nothing to license, while enterprise platforms sell custom quoted annual contracts. Before signing anything, model the bill at double your current table count and ask which monitors add warehouse compute cost on top of the license.
Testing asserts predictions: you write a rule, and the pipeline fails when the rule breaks, so tests only catch failures someone anticipated. Data observability learns the normal behavior of each table, freshness, volume, schema and distribution, and alerts on deviations nobody predicted. Mature teams run both. Tests encode known business rules, while observability covers the growing majority of tables no one has written rules for.
For engineering led teams with time to invest, Great Expectations and Soda are credible starting points and cost nothing to license. The spend shifts from licenses to engineering hours: you build and maintain the deployment, and rule based checks only catch predicted failures. There are no learned baselines, no automated lineage and no incident management out of the box, which is why many teams start open source and migrate to a platform as table counts grow.

First step to AI Readiness
Table of Contents
Sneak peek from the data world.


Bring lineage, quality, governance, and AI together in one platform—so your teams and AI agents can act with confidence.
_For%20light%20backgrounds.svg)
.svg)




.webp)