Snowflake CoCo and CoWork: Governed Context for Agentic AI
How Decube's MCP server extends Snowflake CoCo and CoWork with cross-system lineage, data quality signals, and compliance-ready context for regulated enterprises
Kindly fill up the following to try out our sandbox experience. We will get back to you at the earliest.
Stay ahead of data issues by quickly detecting schema changes, duplicates, and null values.
.webp)


Data observability isn't just about tracking failures; it's about gaining a holistic view of your entire data ecosystem.
With our platform, you can monitor data flow from ingestion to consumption, ensuring every piece of data is accurate, timely, and relevant.
Data downtime can be costly. Our real-time alerting system ensures you’re immediately notified of any issues, allowing for quick intervention. Customize notifications to get the right alerts to the right people, keeping your data pipeline running smoothly.
Adopting a new tool shouldn't mean overhauling your existing systems. Decube integrates seamlessly with your current data stack, ensuring that you can start monitoring your data immediately without disrupting your workflows.
Setting up monitoring shouldn’t be a complex task. With our centralized control panel, you can easily configure and manage all your data monitoring needs from a single, intuitive interface. Streamline your monitoring setup process, reduce manual effort, and ensure consistency across your data assets, all in one place.
Flexibility is key when it comes to monitoring unique business scenarios. With Decube, you can create custom SQL monitors tailored to your specific use cases.
Whether you're tracking query performance or detecting anomalies, our solution allows you to closely monitor and address potential issues, ensuring your data operations align perfectly with your business objectives.
Optimize your data quality checks with a scheduling setup that fits your workflow. Decube allows you to configure and run data quality tests at intervals that suit your needs—whether daily, weekly, or on a custom schedule. Gain the flexibility to ensure your data is always reliable without disrupting your operations.
When you need to address data quality concerns quickly, Decube's on-demand monitoring empowers you to run tests and perform manual checks instantly. Whether you suspect an issue or need to verify data integrity, you can take immediate action to ensure your data remains accurate and trustworthy.
Fine-tune your alerting system to better suit your needs by providing feedback on ML-generated tests. With Decube, you can easily adjust the sensitivity of alerts, ensuring that you’re notified only when it truly matters. Train the system over time to reduce false positives and enhance its accuracy for your unique data environment.
Easily run tests and perform manual checks instantly if you suspect any data quality issues.

Write your own tests with SQL scripts to set up monitoring specific to your needs.

Find where the incident took place and replicate events for faster resolution times.

Enable monitoring across multiple tables within sources by our one-page bulk config.
Choose which fields to monitor with 12 available test types such as null%, regex_match, cardinality etc.
Lorem ipsum dolor sit amet, consectetur adipiscing elit. Nullam fermentum ullamcorper metus ac egestas.

Thresholds for table tests such as Volume and Freshness are auto-detected by our system once data source is connected.
Lorem ipsum dolor sit amet, consectetur adipiscing elit. Nullam fermentum ullamcorper metus ac egestas.

Alerts are grouped so we don't spam you 100s of notifications. We also deliver them directly to your email or Slack.
Lorem ipsum dolor sit amet, consectetur adipiscing elit. Nullam fermentum ullamcorper metus ac egestas.

Always experience missing data? Check for data-diffs between any two datasets such as your staging and production tables.
Lorem ipsum dolor sit amet, consectetur adipiscing elit. Nullam fermentum ullamcorper metus ac egestas.


Automation of Monitors
Data Lineage
Their data contract module is amazing which virtualises and runs monitors.
Big fan of their UI/UX, it simple but managing all the complex task.
My team uses on a daily basis.
Seamless integration with all the data connectors. We also liked the new dbt-core connector directly integrated with Object storage.
Automated Column-Level lineage
Perfect blend of Data Catalog and Data Observability modules.
Business users are able to understand if the reports /dashboard have issues / incidents.
Personally liked the monitors by segment since we have mulitple business it provides incidents breakdown by attributes.

UX and UI, features, flexibility and excellent customer service. People like Manoj Matharu took the time to understand my business and data needs before trying to solution.
One of the best-designed data products. Our complete data infra is getting observed and governed by decube. My fav is the lineage feature which showcases the complete data flow across the components.

What I appreciate most about Decube is its intuitive design and the way it supports maintaining data trust. The platform allows for straightforward monitoring of data quality, making it easier to detect issues early on.One of the most valuable aspects is the transparency it brings to our data pipelines, which also streamlines collaboration among teams. The greatest benefit is the assurance that our data remains accurate, consistent, and prepared for decision-making, all without the need to spend countless hours troubleshooting.

Decube is packaged of solution for us. We were struggling to find one good tool in which we can intigrated with our existing data stack we are using mysql. As a DevOps we used to write crond jobs to check data quality but when we adapt this tool the work and quality both are improved. I highly recommend !


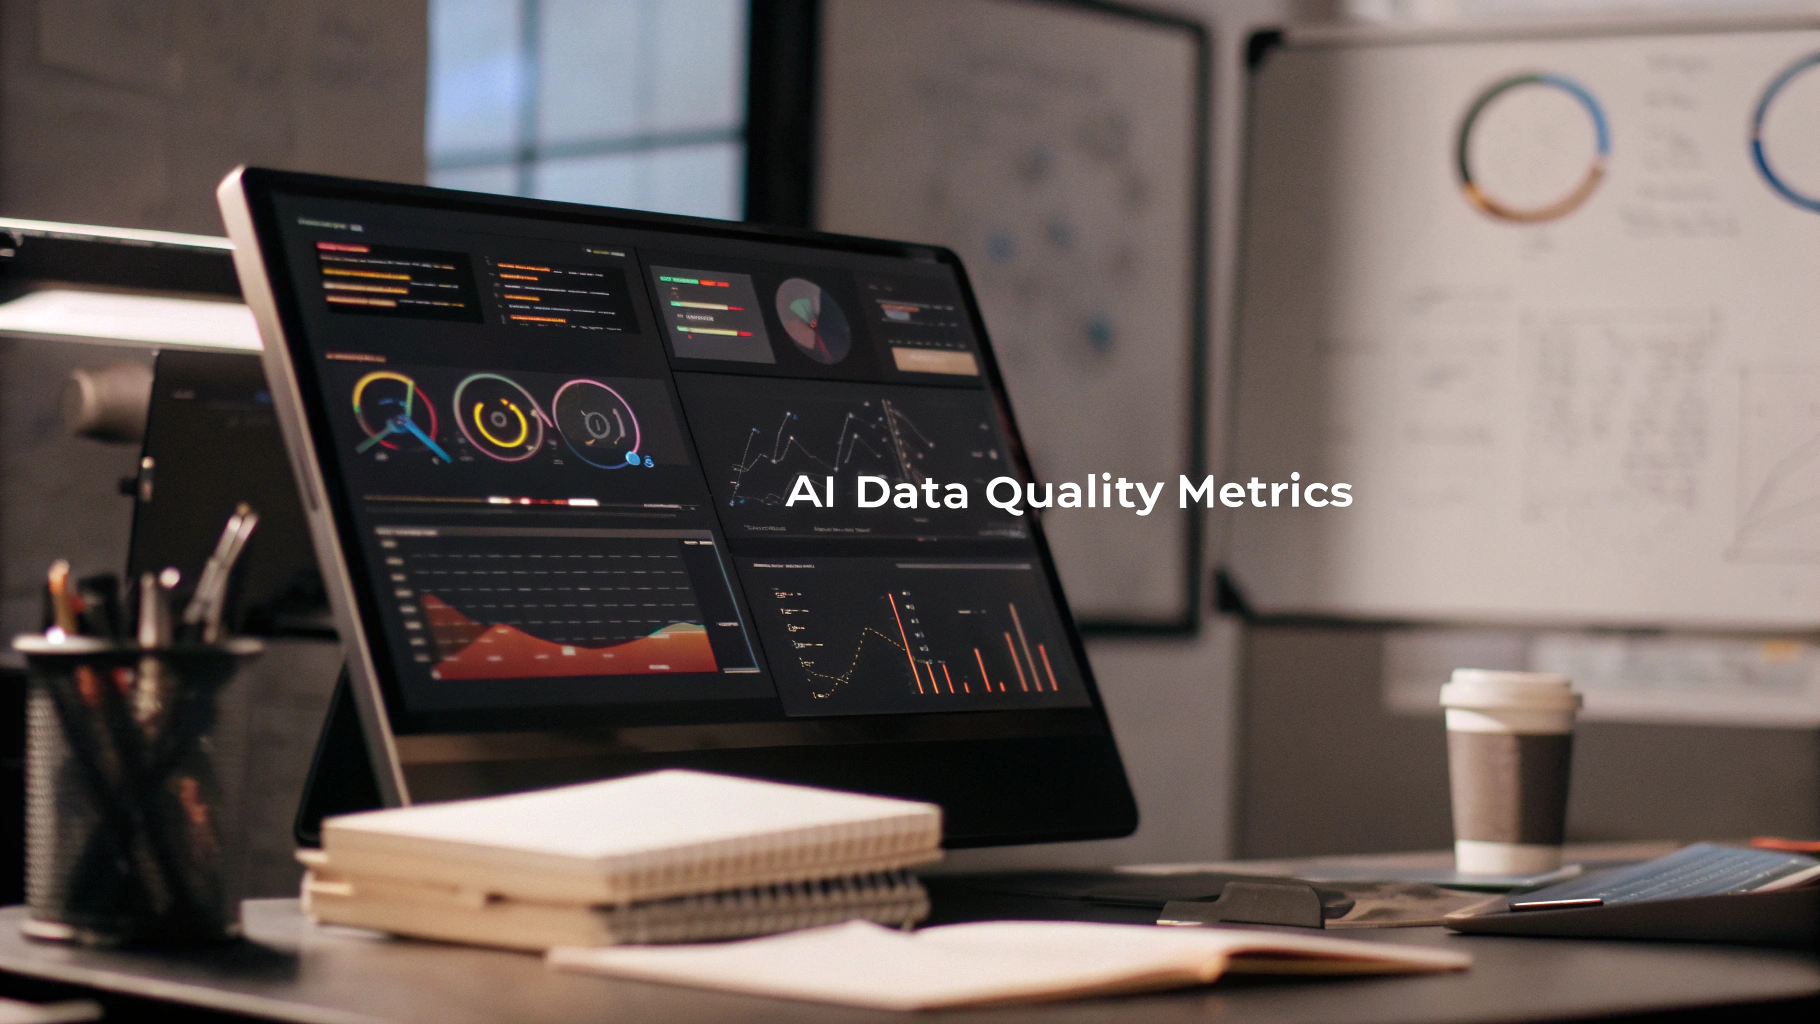
Data Observability refers to the ability to monitor, understand, and ensure the health of data across pipelines, systems, and business applications. It focuses on proactively identifying data quality issues, anomalies, schema changes, and lineage gaps before they impact business decisions or AI models.
Poor data quality can lead to incorrect insights, failed machine learning models, and compliance risks. Data Observability ensures trust in data by continuously monitoring pipelines, detecting anomalies, and giving end-to-end visibility into how data flows through your ecosystem.
Data Quality focuses on measuring attributes like accuracy, completeness, and consistency. Data Observability goes beyond this by providing real-time monitoring, lineage tracking, and root-cause analysis across the entire data stack. Together, they create a reliable foundation for AI and analytics.
Freshness – Is data arriving on time?
Volume – Are data records complete?
Schema – Has the structure changed unexpectedly?
Lineage – Where does the data come from and how is it transformed?
Quality metrics – Is the data correct and usable for business needs?
ROI can be measured by:
Reduction in downtime and failed pipelines
Faster issue resolution (MTTR – Mean Time to Resolution)
Increased trust in analytics and AI models
Compliance cost savings
Improved business decision-making

_For%20light%20backgrounds.svg)