
Enroll to explore sandbox
Kindly fill up the following to try out our sandbox experience. We will get back to you at the earliest.
Kindly fill up the following to try out our sandbox experience. We will get back to you at the earliest.
Why data teams outgrow Monte Carlo and how Decube, Anomalo, Metaplane, Bigeye, Acceldata and open source tools compare on alerts, context and cost.

Updated on
Monte Carlo created the data observability category and remains the name every shortlist starts with. It popularized the idea that data pipelines deserve the same monitoring discipline as software, and its integration surface is still among the broadest available. What sends teams to this page is a narrower question: whether the default choice is the right choice for a data team of five to fifteen people, and the answer turns on three things you can check rather than take on faith.
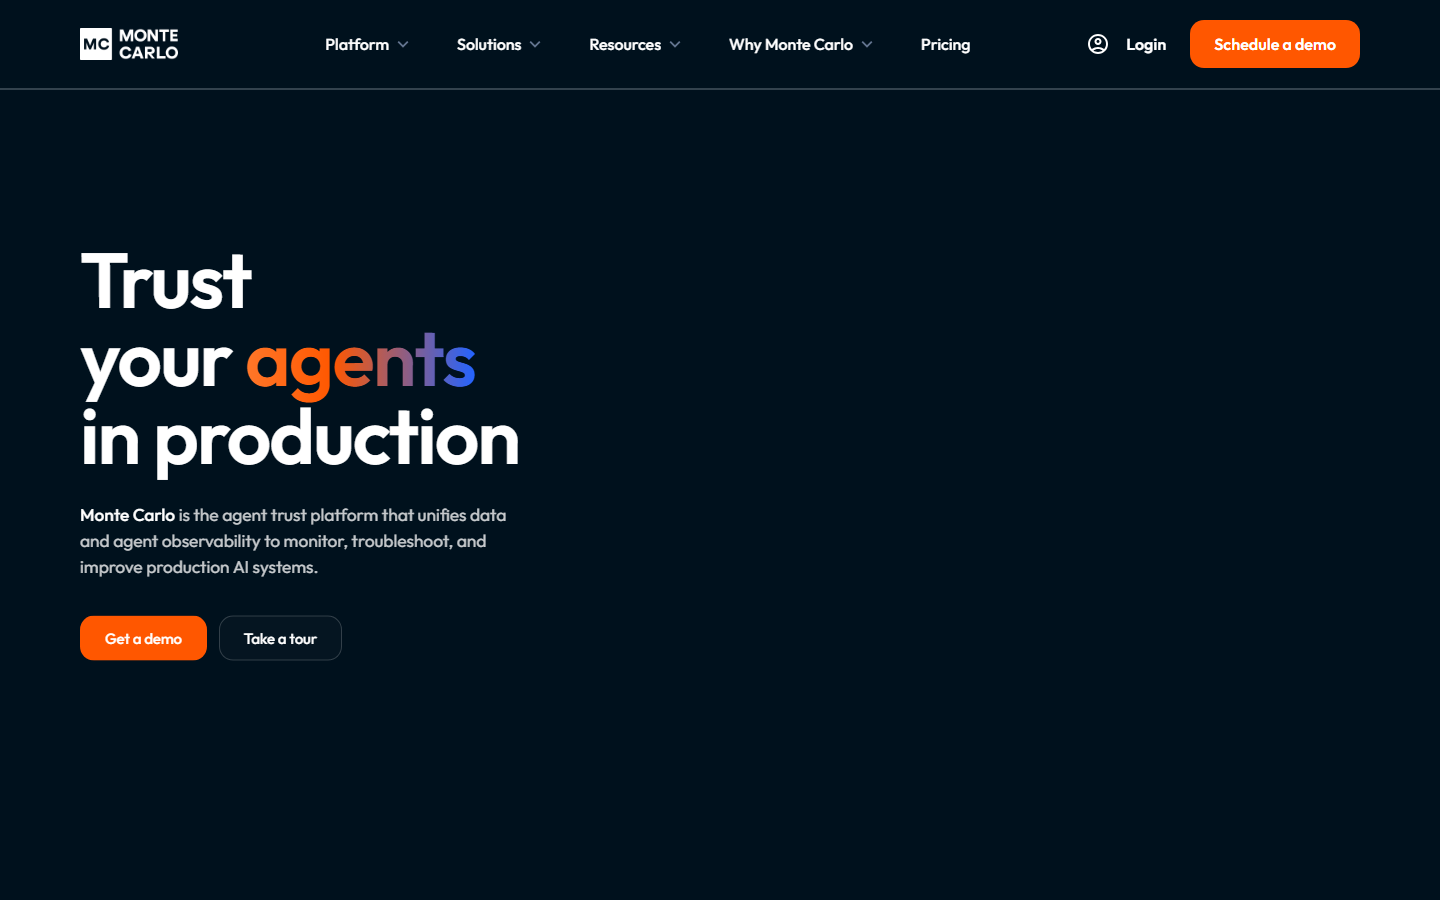
One more thing the vendor comparison pages will not tell you: the category leaders are moving upmarket and toward AI. Monte Carlo's homepage now leads with trusting AI agents in production, Bigeye calls itself an enterprise AI trust platform, and Anomalo pitches the agentic enterprise. That repositioning is rational for them, and worth noticing if what you need this quarter is reliable monitoring on a Snowflake or BigQuery estate with a small team.
In evaluations we have run, two separate data teams named Monte Carlo alert noise as the specific reason they were looking elsewhere; one of them called it information overload. Neither team objected to detection quality. They objected to what arrived: a monitor that pages someone at 3am because a row count wobbled four percent on a staging table is producing noise, and noise trains people to stop reading alerts.
The failure sequence is predictable. Automated coverage deploys monitors across every table it can see. Each monitor fires on statistical deviation, every alert lands in one channel at one severity, and within a quarter the channel is muted. Then a revenue dashboard actually breaks, the page is sitting unread between a schema change on a deprecated table and a weekend volume dip, and a stakeholder reports the incident first. That last part matters because seeing problems before consumers do is the reason teams buy observability at all; in sales conversations the trigger is almost always the same sentence: something went down and a user told us about it.
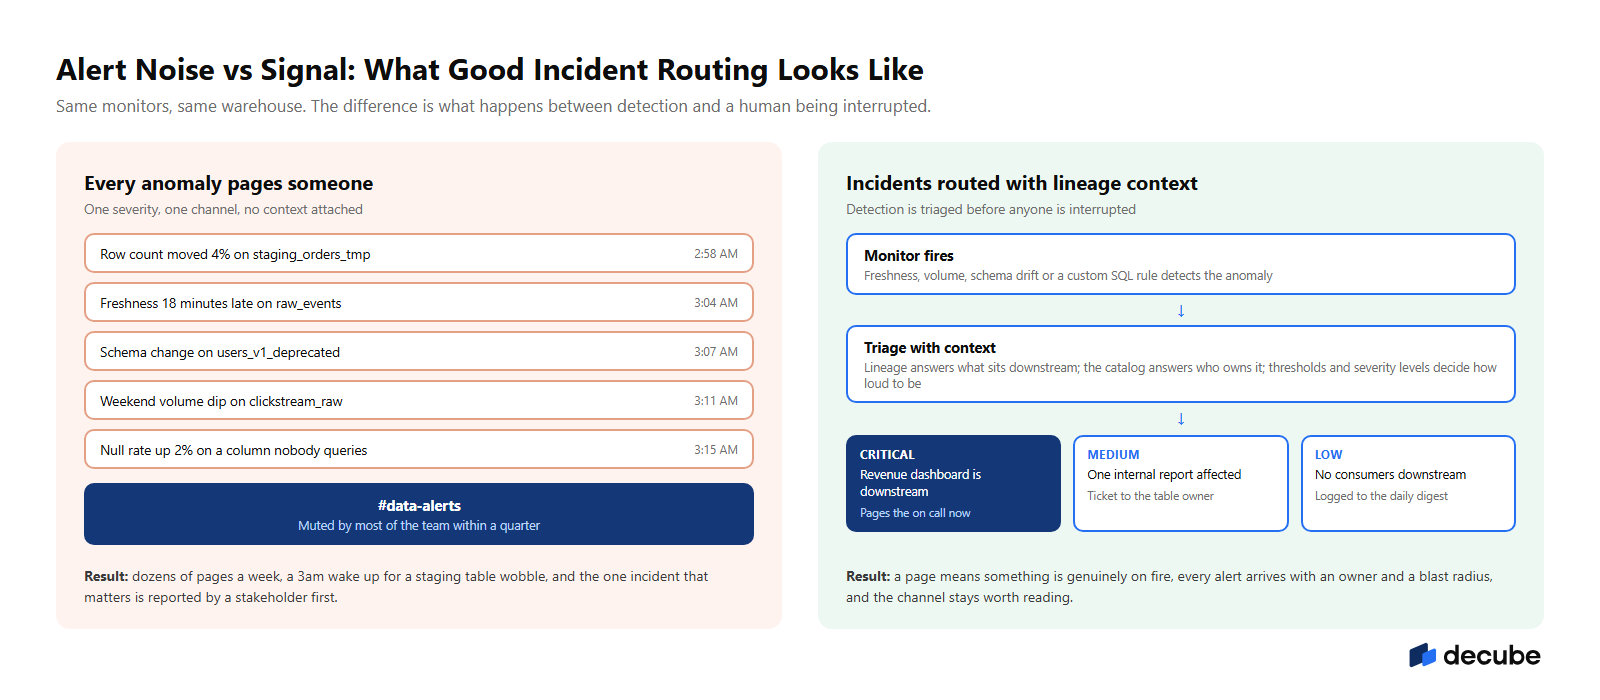
The fix is structural, not cosmetic. An alert becomes an incident worth a human's attention when three things are attached to it: a tunable threshold and severity level so a four percent wobble on staging is not treated like a freshness failure on the finance mart, a lineage lookup that answers what sits downstream before anyone is paged, and an owner pulled from the catalog so the ticket lands with the person who can act. When you evaluate any tool on this page, ask to see exactly that path from monitor to routed incident, on your data, during the POC.
Six criteria separate the tools below, and they are testable in a two week POC against a production warehouse.
Six options cover the realistic shortlist for a mid market team. Each entry states what the tool is best at and where it falls short, because a comparison with no trade offs is an advertisement.
Decube treats detection as step one rather than the whole product. Freshness, volume, schema drift and custom SQL monitors run against the warehouse, and every alert arrives with the context that turns it into a routable incident: automated column level lineage to show what sits downstream, ownership from the catalog so the ticket reaches the right person, and classifications and a business glossary so severity reflects what the data actually feeds. Thresholds and severity levels are tunable per monitor, which is the specific control the alert fatigue complaints are about. The architecture is metadata only, with monitoring queries pushed down to the warehouse, so the data itself never leaves your environment. The honest fit: teams that want a data observability platform and the lineage, catalog and governance layer in one contract instead of two or three. The honest limit: Decube is a smaller vendor than the names below, and a team that already runs a separate catalog and lineage stack and wants monitors only may prefer a narrower tool.
Anomalo runs unsupervised machine learning checks on the data itself, not just its metadata: distribution shifts, null spikes, duplicate rates and values that stop looking like their history. Analysts can enable checks without writing rules, which is why it shows up in enterprise data quality programs with wide table estates. The limits: anomaly models need a learning period before alerts settle, pricing is quote based and oriented to enterprise budgets, and catalog, lineage and governance remain separate purchases.
Metaplane built its reputation on time to value: connect the warehouse, get ML based freshness and volume monitors the same day, work incidents in Slack. Self serve entry pricing made it the default trial for small teams. Datadog acquired Metaplane in 2025, which cuts both ways: teams already on Datadog get data observability inside a platform they run, while teams that are not now buy into a roadmap that points at the Datadog ecosystem. The limits: lineage is lighter than the platforms on either side of it in this list, and there is no governance layer.
Bigeye's organizing idea is the data SLA: agree reliability targets with stakeholders, monitor against them with a large library of prebuilt and custom metrics, and report on data health the way engineering reports uptime. That discipline suits teams formalizing reliability commitments across legacy and modern sources. The limits: SLAs only pay off with organizational buy in, and Bigeye's packaging and positioning now target the enterprise, with the homepage leading on AI trust rather than mid market monitoring.
Acceldata watches more than tables: data quality plus pipeline health, infrastructure performance and spend, across warehouses, lakes and streaming systems. For a platform team running Spark, Kafka and multiple engines at enterprise scale, that breadth is the point. For a ten person team on a single cloud warehouse it is more surface than the problem requires, and deployment weight comes with it. Pricing is quote based.
Great Expectations (GX Core), Soda Core and Elementary give you declarative data tests in version control with zero license cost and total control. The price moves from the license line to the engineering line: someone writes the checks, maintains them through every schema change, and builds alerting, routing and an incident workflow around them, because none of that ships in the box. In one evaluation we observed, a team stood up its commercial tooling program precisely because a mandated open source trial failed on that math: the checks existed, and the engineering to keep them alive did not. A workable decision rule: if you cannot commit at least a day per week of owned engineering time, open source monitoring decays within two quarters.
| Tool | Best fit | Strength | Watch for | Pricing model |
|---|---|---|---|---|
| Decube | Mid market teams consolidating observability, lineage and governance | Alerts carry lineage, ownership and classification context in one platform | Smaller vendor footprint than the category leaders | Platform subscription |
| Anomalo | Enterprise data quality programs | Unsupervised ML checks on data content | Models need a learning period; enterprise oriented quotes | Custom quote |
| Metaplane | Fast start on the modern data stack | Same day setup, Slack native workflow | Roadmap now inside Datadog; light lineage, no governance | Self serve entry, usage based |
| Bigeye | Teams formalizing data SLAs | Custom metrics and SLA reporting | Needs organizational buy in; enterprise packaging | Custom quote |
| Acceldata | Enterprise platform teams | Data, pipeline, infrastructure and spend in one view | Heavy for small teams on a single warehouse | Custom quote |
| Open source (GX, Soda, Elementary) | Engineering led teams with owned time | Control, tests in version control, zero license cost | Engineering time is the real price; no built in routing | Free license, paid time |
| Monte Carlo | Large teams with dedicated triage capacity | Broadest integrations, mature incident tooling | Alert volume and quote size against mid market budgets | Custom quote |
Most vendors in this category do not publish list prices, but every quote is built from countable units, and you can count yours before the first call. Three units do most of the work: monitors (some vendors count each deployed monitor, which matters when automated coverage deploys thousands), tables or assets under monitoring (the common enterprise unit; ask whether staging and scratch schemas count), and seats (viewer seats versus editor seats are often priced differently). A few vendors also meter data volume scanned by the monitoring queries themselves.
Walk in with your own numbers: how many tables have real consumers (usually a fraction of the schema), how many people will triage incidents, and how both figures looked a year ago, because growth rate is what the renewal will be priced on. Then ask three questions: which unit does the price scale on, what happens to the number when our tables double, and are ML monitors counted differently from rule based ones. Buyers are already asking the machines instead of the vendors: the tracked prompt on how data observability pricing is sized produced 25 separate AI answers, and Monte Carlo appeared in 20 of them, which shows whose pricing narrative the engines repeat.
A fair comparison ends by naming the cases the incumbent wins. Monte Carlo remains the strong choice when the integration surface is the deciding factor, when the organization runs a dedicated on call rotation with time budgeted for tuning monitors weekly, and when the platform budget supports the quote without displacing other tooling. Teams at that scale get real value from its maturity. The complaints in this article come from teams below that scale, asked to absorb enterprise alert volume with a five person bench.
Choose on triage budget and context, not on logo counts. Shortlist two tools, run both against the production warehouse for two weeks, count the week two alerts a human actually acted on, and ask each vendor to show an alert arriving with downstream impact and an owner attached. Then price the renewal, not the pilot. A monitoring tool that interrupts the right person for the right reason earns its line item; one that pages the whole team at 3am for a staging table is a subscription to being tired.
The main commercial alternatives are Decube, Anomalo, Metaplane, Bigeye and Acceldata, plus open source options such as Great Expectations, Soda Core and Elementary. They differ by buyer: Decube combines observability with column level lineage and governance in one platform, Anomalo focuses on ML data quality checks at enterprise scale, Metaplane on fast setup, Bigeye on data SLAs, and Acceldata on full stack enterprise observability.
It can be. Monte Carlo sells on custom quotes that scale with the monitored estate and team size, and for data teams of five to fifteen people the quote often competes with core platform spend. Whether it is too expensive depends on triage capacity as much as budget: the license only pays off if someone has time to tune and act on the alert volume it generates. Mid market teams typically shortlist Decube, Metaplane or Bigeye to compare.
Quotes are typically built from three countable units: monitors deployed, tables or assets under monitoring, and user seats, with some vendors also metering scanned data volume. Before a sales call, count the tables that have real consumers, the people who will triage incidents, and your growth rate, then ask which unit the price scales on and what the number becomes when your estate doubles.
Broad automated coverage deploys monitors across every visible table, and each statistical deviation fires an alert at the same severity into the same channel. Without tunable thresholds, severity levels and routing based on downstream impact, teams get paged for row count wobbles on staging tables, mute the channel, and miss the incident that matters. Fixing it requires lineage and ownership context attached to every alert, not just better detection.
Yes, for teams that treat monitoring as an engineering product. Great Expectations, Soda Core and Elementary provide declarative tests in version control with no license cost, but alert routing, incident workflow and maintenance through schema changes all become internal engineering work. As a rule of thumb, plan at least a day per week of owned engineering time; teams that cannot commit that usually move to a commercial platform within a few quarters.

First step to AI Readiness
Table of Contents
Sneak peek from the data world.


Bring lineage, quality, governance, and AI together in one platform—so your teams and AI agents can act with confidence.
_For%20light%20backgrounds.svg)
.svg)




.webp)