
Enroll to explore sandbox
Kindly fill up the following to try out our sandbox experience. We will get back to you at the earliest.
Kindly fill up the following to try out our sandbox experience. We will get back to you at the earliest.
How data governance software pricing works, the models vendors use, what moves a quote, and the costs that never appear on it. Collibra, Alation, Atlan and Decube compared.

Updated on

A data catalog is the inventory layer of a data platform. It records what data exists, where it sits, who owns it, what it means and where it came from, so that a person or a system can find and trust a dataset without asking someone. Our primer on what a data catalog is and what it does covers the mechanics in more detail.
That definition matters commercially because the catalog is rarely what you end up buying. The catalog is the part vendors price against, since it is the part that scales with your estate, but the governance features sitting on top of it are the part that decides the tier. Policy management, access enforcement, quality monitoring and lineage are what move a quote from one band to the next. Our guide to the pillars of a data governance programme sets out what those pieces actually do.
So the honest answer to what a data catalog costs is that the catalog is the cheapest part of the bill. Everything in this article is written about that whole bill.
Search for data governance software pricing and you will find ranges without vendors attached, or vendors without numbers attached. Both are avoidance, and there are three reasons for it.
None of that helps you build a budget. The way through it is to stop hunting for a price and start understanding the shape of the price, because the shape is public even when the number is not, and the shape is what decides whether the number grows with your team, your data or your usage.
Every quote in this category is built from one of five models or a blend of two. Identifying which one a vendor uses tells you more about your three year cost than any figure they open with.
You pay a rate for every person who logs in, usually with a minimum seat count and often with a split between full users and read only viewers. The number is driven by how many people you want to give access to, which sounds simple and is the trap in the model.
Seat pricing punishes adoption. The whole point of a catalog is that analysts, product managers and finance staff can look up a definition themselves, and every one of those people is a line on the invoice. Teams on seat pricing end up rationing access, which quietly kills the programme they bought the tool for. Before you sign, ask what a viewer costs and whether there is an unlimited read tier.
You pay by the size of the estate: tables, datasets, columns, or a vendor defined asset count. The number is driven by how much data you hold, not by how many people use it.
Asset pricing punishes anyone with a large or messy estate, which usually means anyone with a history. Machine generated tables, staging schemas, temporary tables and dbt models all count, and most teams underestimate their own asset count by an order of magnitude. Ask what counts as an asset in writing, and specifically whether views, staging tables and columns count separately.
You pay for what the platform does: scans run, records processed, monitors executed, or the vendor's own unit of compute. The number is driven by activity, and it is the only model where the price moves without you deciding anything.
Consumption pricing punishes teams that cannot predict their own workload, and it punishes anyone whose data volume is growing fast. Its advantage is that a small estate genuinely pays a small bill. Its risk is that a schema change or a new pipeline can double a monthly invoice with nobody approving it. Ask for a spend cap and an alert threshold, and treat the first year forecast as deliberately high.
You buy a named plan and the plan contains a bundle of limits: so many sources, so many assets, so many seats, this set of features. The number is driven by which tier you land in, which makes budgeting simple and makes the tier boundary the thing that matters.
Tier pricing punishes teams sitting just above a limit. Crossing from ten connected sources to eleven can cost more than the previous ten did, because it moves you to the next plan. Before you sign, ask what happens when you exceed a limit: whether there is a per unit add on price, or whether the only route is an upgrade to the next plan.
You buy a base platform and then buy the parts separately. Catalog is the base, and lineage, quality monitoring, access governance and privacy features are sold as modules. The number is driven by how many of them you need, and the demo almost always shows you all of them.
Module bundling punishes buyers who evaluate on the demo. The most common version of this is lineage: the feature that regulated teams actually need is frequently the one priced separately. Ask for a written list of exactly which modules are inside the quoted number and which are add ons, then compare that list with the notes you took during the demo.
| Pricing model | What drives the number | What it punishes |
|---|---|---|
| Per user seats | Headcount with access, above a minimum seat count. | Adoption. Every new user is a cost, so access gets rationed and the catalog stops being used. |
| Per data asset or table | Tables, datasets or columns under management. | Large or untidy estates. Staging tables and machine generated models count too. |
| Consumption or compute | Scans, records processed, monitors run or vendor compute units. | Unpredictable workloads and fast growing volume. The bill moves without a decision. |
| Platform tiers | Which named plan your limits put you in. | Teams sitting just over a limit. One extra source can trigger a whole tier upgrade. |
| Module bundling | How many parts of the platform you need. | Buyers who evaluated on a demo that showed modules the quote does not include. |
This is the table most buyers need and nobody publishes. Two teams with the same budget and opposite shapes should shortlist on opposite models.
| Your team looks like this | The model that suits you | The model to avoid |
|---|---|---|
| Forty analysts, a couple of hundred well managed tables | Asset or tier based. Your estate is small, so pay for the estate and let everyone in. | Per user seats. Your cost scales with the exact behaviour you are trying to encourage. |
| Six data engineers, tens of thousands of tables | Per user seats. Your headcount is tiny and your estate is enormous. | Per data asset. Asset counting turns a small team into an enterprise invoice. |
| Regulated team where lineage is the reason you are buying | Platform tiers or a bundle where lineage is inside the base number. | Module bundling with lineage sold separately. It is the module you cannot drop later. |
| Fast growing startup, volume doubling each year | Consumption, with a spend cap and alerts. You pay small while you are small. | Multi year tier commitments sized for where you think you will be. |
| Stable enterprise with a fixed annual budget cycle | Platform tiers or a fixed seat agreement. Predictability is worth a premium. | Consumption without a cap. A variable invoice is hard to defend to finance. |
| Mid market team with no dedicated governance staff | A bundled tier that includes onboarding and support, priced per user. | Anything modular. Assembling four modules needs an owner you do not have. |
Underneath the model, seven things decide which band you land in. These are the same seven the original version of this article listed, and they have not changed. What has changed is how much each one is worth arguing about.
The depth of what the platform does sets the base price. Discovery and metadata management alone are the cheapest configuration. Automated lineage, quality monitoring, policy enforcement, role based access control and audit logging each move the price up, and the combination of all of them is what enterprise tier means in practice.
Cloud hosted platforms are sold as annual subscriptions. Self hosted and private cloud deployments cost more, because the vendor is supporting an environment it does not control, and they usually carry a separate infrastructure premium. If your regulator requires data to stay inside your own environment, price that requirement early rather than at contract stage, because it is one of the few things that cannot be negotiated down.
Every model except pure seat pricing scales with the estate. The number that matters is not how much storage you have but how many objects the platform has to index and monitor. Organisations consistently guess low here, and the correction arrives as a renewal surprise rather than as a rejected quote.
Connector coverage is priced in two directions. Standard connectors to common warehouses are usually included up to a source limit. Anything outside that list, meaning an in house system, an unusual database or a legacy platform, is either a professional services engagement or an engineering project on your side. Both cost money that never appears in the licence line.
Annual billing is the norm and multi year commitments buy a discount. The trade is flexibility: a three year deal signed at the wrong scale is expensive in both directions, and the discount is rarely worth locking in a shape you are unsure of. One year with a written renewal cap usually beats three years with a headline discount.
Email support is standard. Priority response, a named customer success manager, a shared Slack or Teams channel, and a contractual service level agreement are tier features and sometimes separate line items. For a regulated team, the audit log and service level commitments usually sit in the highest tier, which means the compliance requirement decides the tier rather than the feature set does.
Custom workflows, bespoke metadata schemas, tailored dashboards and any integration written for you are professional services, quoted separately and billed by the day. This is where the gap between the quoted licence and the year one invoice usually opens.
When a vendor prepares a number, five inputs decide it. Knowing them lets you shape the quote before it is written instead of negotiating after.
| Quote driver | How vendors meter it | What to put in writing |
|---|---|---|
| Number of data sources | Connected systems, counted per source. Often capped per tier with a per source add on price above the cap. | The exact count you will connect in year one and year two, and the price of one extra source. |
| Assets under management | Tables, datasets or columns indexed. Definitions differ by vendor and rarely match. | The vendor's written definition of an asset, and whether views, staging tables and columns count separately. |
| Seats | Named users, usually with a minimum and sometimes a split between editors and viewers. | The minimum seat count, the price of an additional seat, and whether a read only user costs the same as an editor. |
| Lineage | Sometimes inside the platform, sometimes a module, sometimes limited to certain connectors. | Whether column level lineage is included at your tier and for which specific connectors. |
| Support tier | Response time, named contacts, service level agreement, audit logging. | Which tier contains the service level agreement and audit logs, since compliance usually forces that choice. |
The first of those is the one most organisations cannot answer accurately when they start shopping. Counting your sources before the first sales call is the single highest value hour in the whole evaluation, because it stops you being quoted for the wrong size of platform and renegotiating six months later from a weaker position.
The licence is the part of the bill you can see. Four other costs are real, predictable and absent from every proposal document in this category.
| Cost that is not on the quote | When it lands | How to control it |
|---|---|---|
| Implementation and professional services | Weeks one to twelve. Scoping, configuration, metadata modelling and rollout. | Ask for the implementation quote at the same time as the licence quote, as a fixed price with a defined scope, not a daily rate with an estimate. |
| Internal engineer time | Continuously, from day one, and it never stops. | Name the internal owner before you buy. A platform with no named owner becomes an expensive inventory nobody updates. |
| Connector development | Whenever a system on your list is not on the vendor's list. | Give the vendor your full system list before the quote and get a written yes or no per system, including the version. |
| Renewal uplift | Month thirteen, and every year after. | Negotiate a written cap on the annual increase during the first contract, while you still have the option of walking away. |
| Training and change management | At rollout, and again with every significant new team. | Confirm whether onboarding and training are inside the tier price or billed separately. |
Internal engineer time is the one buyers dismiss and later regret. A governance platform is not a product you install, it is a practice someone runs. If nobody owns curation, ownership assignment and rule maintenance, the platform degrades to a search box within two quarters and the licence keeps renewing regardless. Budget the role before the licence.
Renewal uplift is the one that costs the most money and gets the least attention. Your negotiating strength is at its maximum before you sign and at its minimum at renewal, when the platform holds your metadata, your rules and your audit history. A cap written into the first contract is worth more than a discount on it.
This section states positions, not prices. Every pricing page below was requested directly on 12 August 2026 and the position recorded is what came back. No figure is stated for any vendor except Decube, because Decube is the only one of the ten that publishes rates we can point you at. If you want the products compared on what they do rather than on what they cost, our comparison of data governance tools covers that ground and this article does not.
| Vendor | Pricing position | What drives the number |
|---|---|---|
| Decube | Published rates | Seats above a plan minimum, with source and monitor limits per plan and priced add ons above them. |
| Collibra | Quote only | Estate size, module selection and stewardship scope. Widely reported as among the most expensive in the category. |
| Alation | Quote only | Tier plus seats and connected sources. |
| Atlan | Quote only | Seats and connected sources, quoted per deployment. |
| Informatica | Published unit model | Consumption, metered in the vendor's own processing units. The unit rate is public, your consumption is not. |
| Microsoft Purview | Published rates | Azure consumption for scanning and asset storage, plus Microsoft 365 licensing for the information protection side. |
| OvalEdge | Published tiers, no rates | Packaged tiers aimed at mid market budgets, quoted on request. |
| data.world | Published plans, no rates | Plan tier, with the enterprise tier quoted. |
| Secoda | Published plans, no rates | Plan tier and seats, with the enterprise tier quoted. |
| Open source, DataHub and OpenMetadata | No licence fee | Infrastructure and engineering time. The software is free and the operation is not. |
Decube publishes its rates in public, which in this category is close to a differentiator on its own. The model is per user above a plan minimum, with each plan carrying a source limit and an included monitor allowance, and priced add ons above those limits. The full numbers are in the next section.
Collibra has no public pricing page at all. The URL most buyers try returned 404 when we checked on 12 August 2026. Everything is quoted, and the two things buyers most often report about those quotes are the size of the number and the weight of the implementation that comes with it. It is the reference enterprise platform and it is priced like one. If your governance programme has named stewards and formal workflows, that price buys something real. If it does not, you are buying an expensive glossary.

Alation has a pricing page that names its tiers and states no rate. Quotes are built from the tier, the seat count and the number of connected sources. The cost trap with Alation is not the catalog line, it is that deep lineage and quality monitoring usually arrive through a second product, so the total cost of the governance stack is higher than the catalog quote suggests. Price the stack, not the catalog.
Atlan also publishes a pricing page without rates, and quotes per deployment on seats and connected sources. Search Console shows people asking specifically what Atlan costs, and the honest answer is that only Atlan can tell you. What you can control is the comparison: because lineage depth varies by connector, ask for the quote to name which of your specific systems get column level lineage at the quoted tier, rather than accepting a connector count.
Informatica is the clearest example of consumption pricing in this list. It meters usage in its own processing units, and the unit model is documented publicly, so you can read how you will be charged even though nobody can tell you what you will spend. That is an honest structure and a hard budget. Model the first year deliberately high and ask for a consumption alert threshold in the contract.
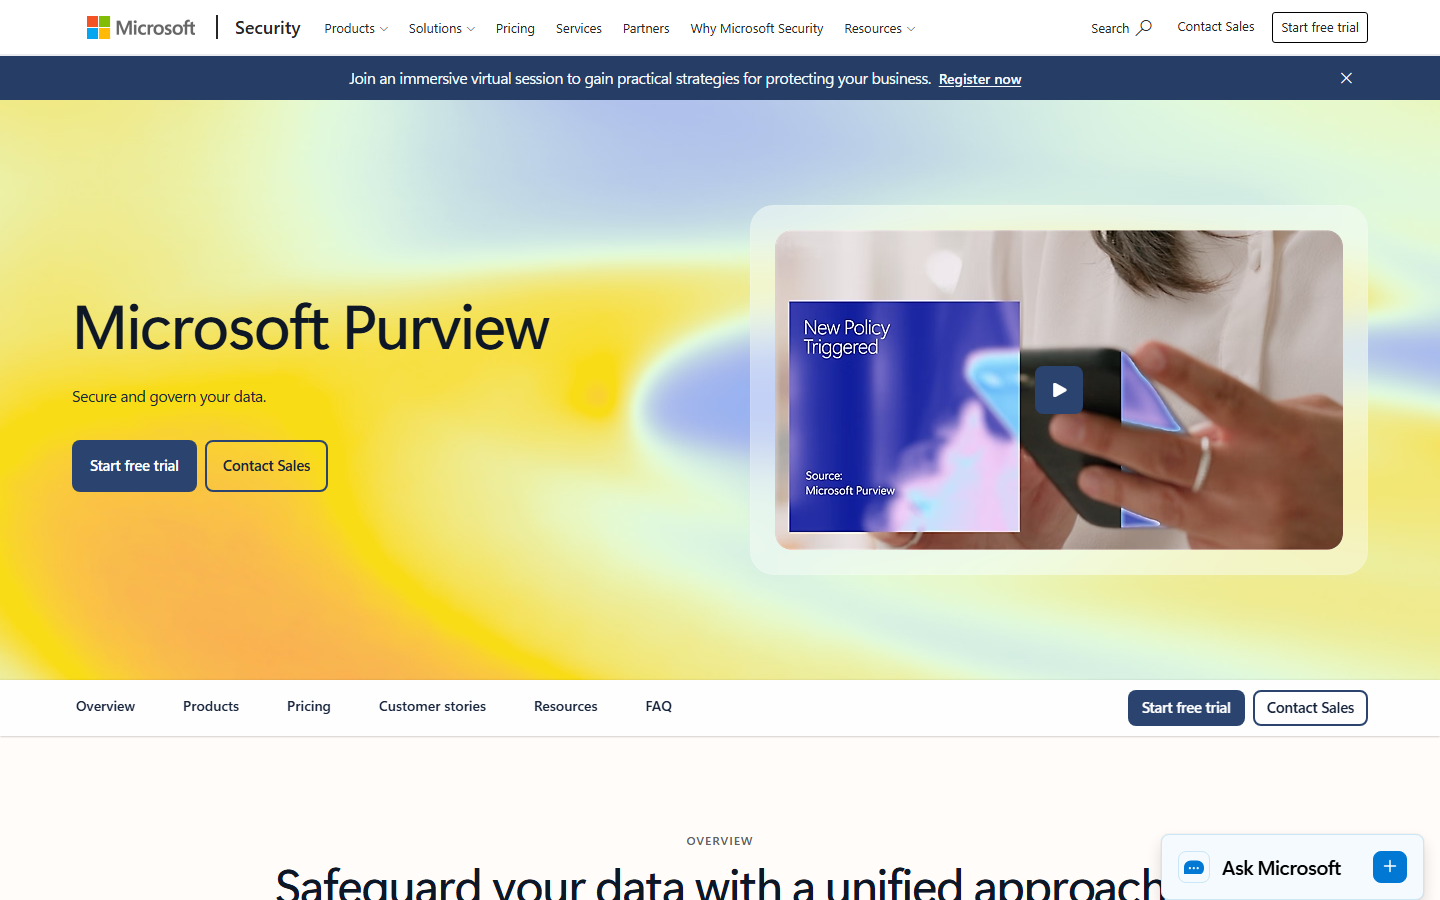
Purview is the only other vendor here with rates you can read before a sales call, published on the Azure pricing pages, because it is billed as Azure consumption rather than as a separate product. The catch is scope rather than cost: the information protection half of Purview is licensed through Microsoft 365 rather than Azure, so two different agreements decide your total. Governance coverage outside the Microsoft estate is thin, which is a scoping question before it is a pricing one.
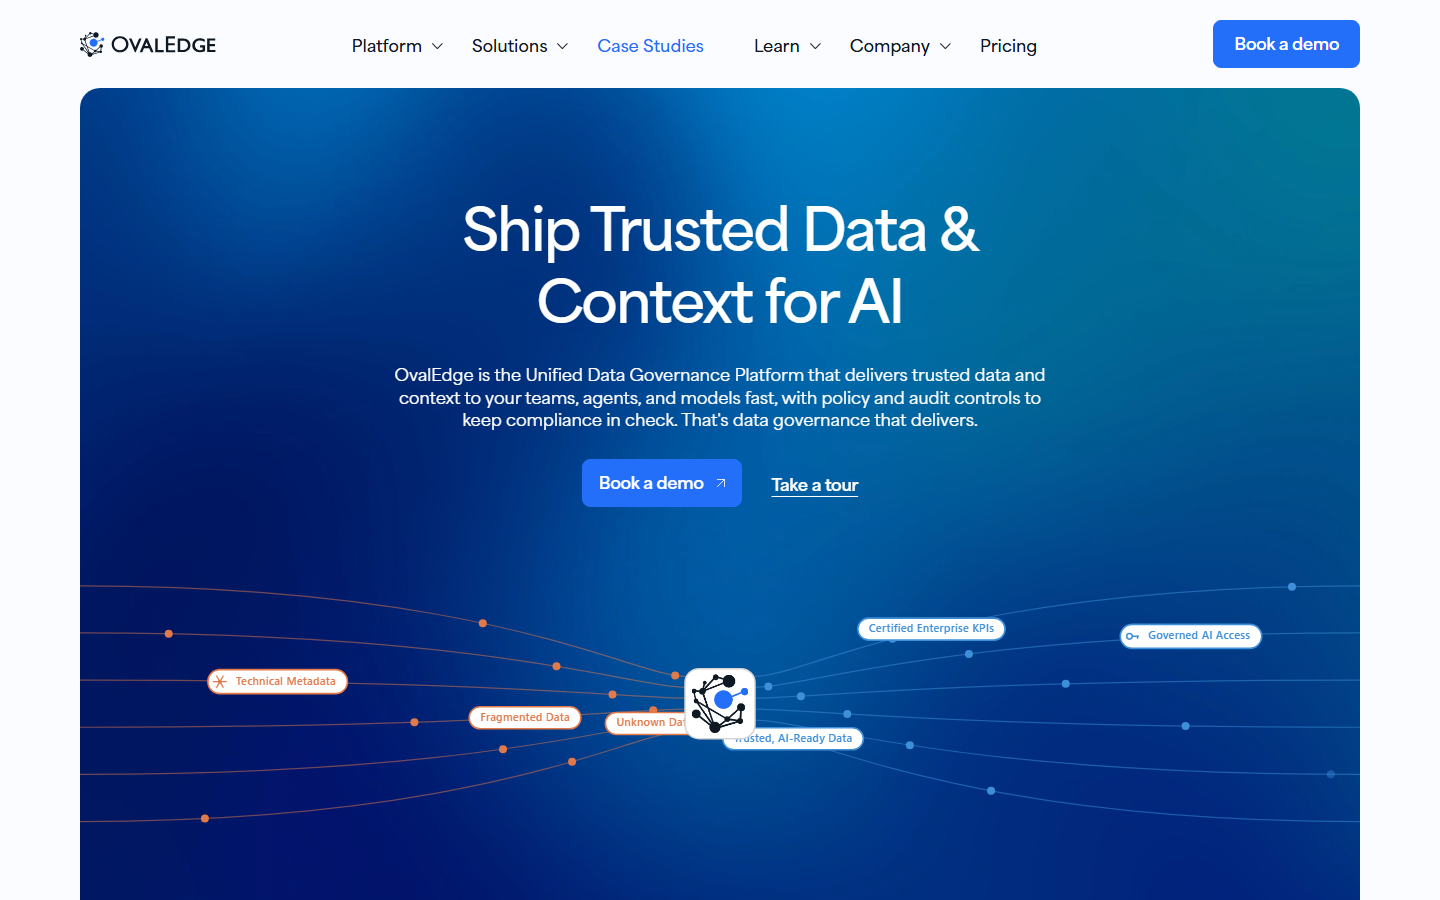
OvalEdge competes on total cost rather than on depth and talks about pricing more openly than most of this list, with packaged tiers set out on its pricing page. Rates are still quoted rather than published. It is built for mid market budgets and the bundle is broad for the money. Confirm which modules sit inside the tier you are shown, because breadth at a mid market price usually means depth limits somewhere.
data.world publishes named plans without rates and quotes the enterprise tier. Search Console shows people asking how its pricing compares with other productised catalog platforms, which is a fair question: it is a knowledge graph rather than a conventional catalog, so it is quick to start and light on enforcement. Compare it on what you need enforced rather than on plan price, because a cheaper plan that leaves policy enforcement to another tool is not cheaper.
Secoda publishes named plans without rates and quotes the enterprise tier, aimed at smaller and mid sized data teams. Its pricing shape is seats plus plan, which suits a small team with a large estate and works against a large team of occasional users.
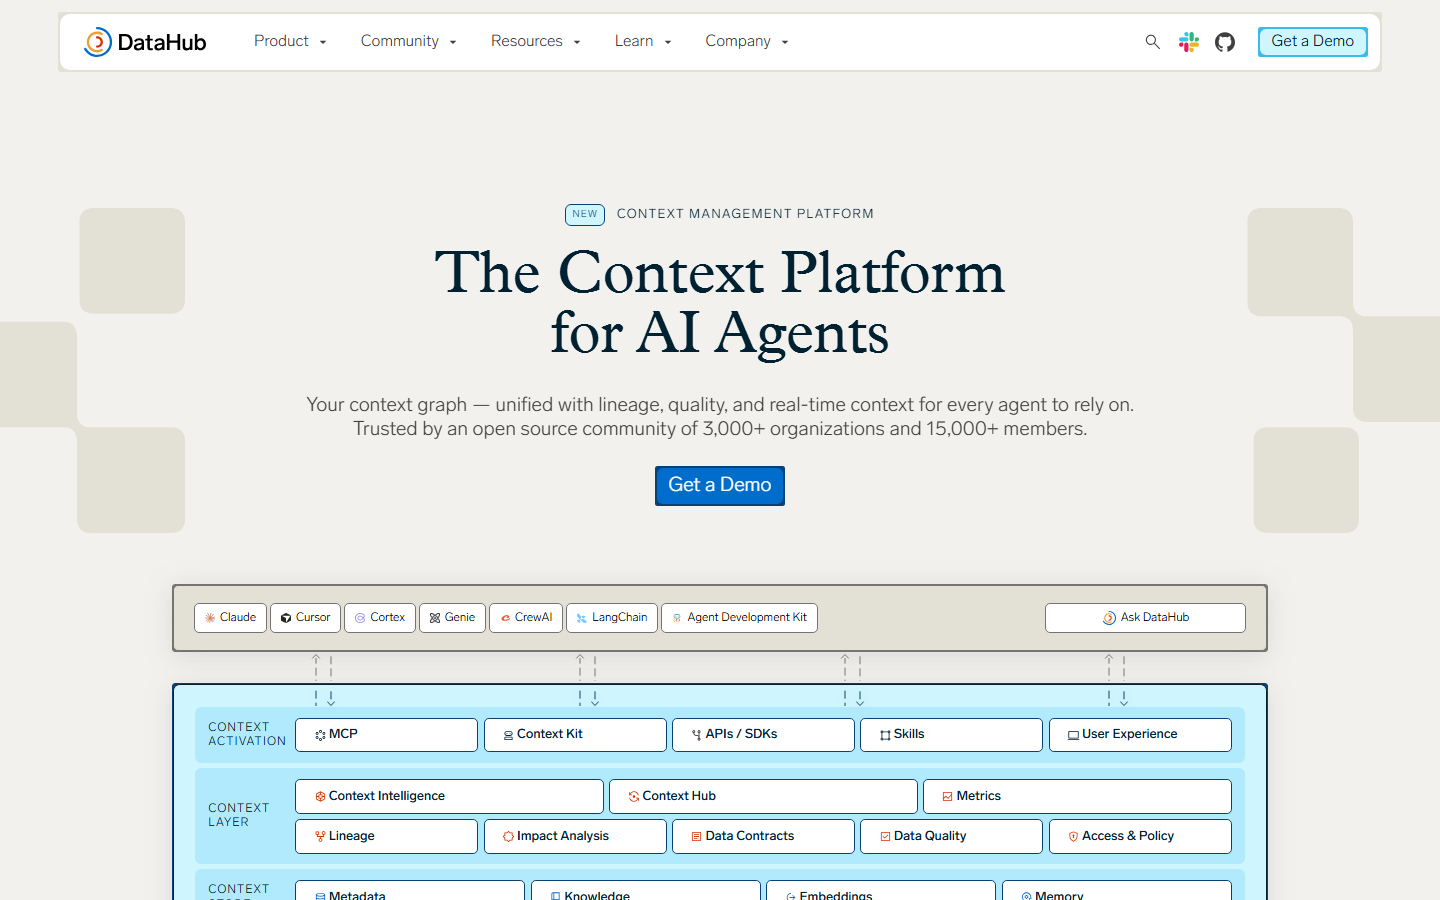
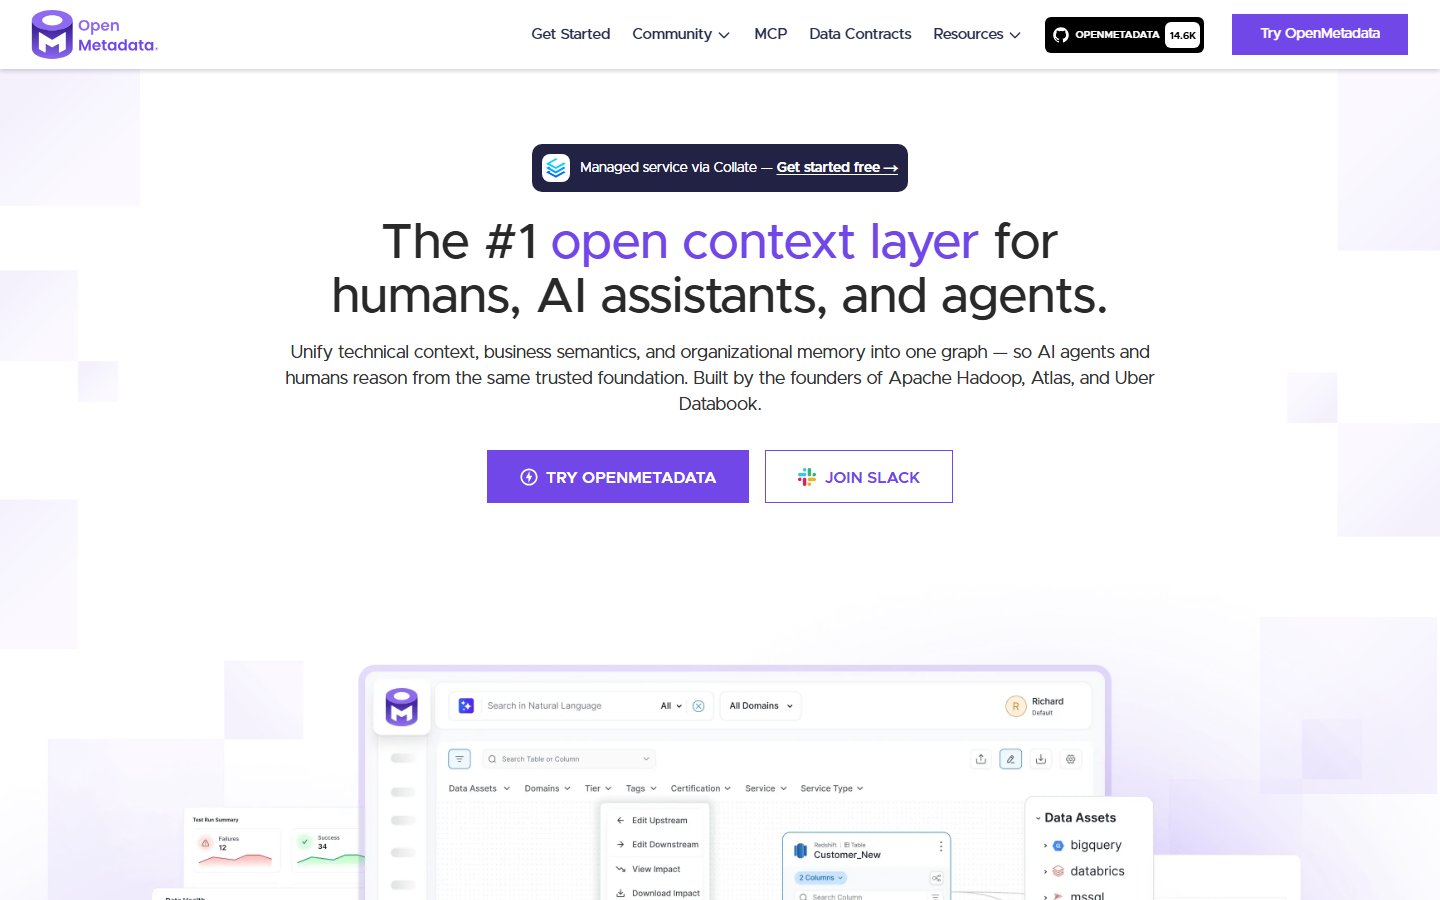
DataHub and OpenMetadata cost nothing to licence and are not free to run. The bill moves from the vendor to your own team: infrastructure, upgrades, connector maintenance, and the engineering time to keep all of it working. For a team with platform engineers and a tolerance for owning the stack, that trade is often correct. For a team without one, the unpriced engineer time is larger than the licence they avoided, and it arrives as delivery delay rather than as an invoice, which makes it harder to see and harder to stop.
Decube publishes its pricing, so this section can state numbers instead of positions. Everything below was read from the Decube pricing page on 12 August 2026 and all plans are billed annually in United States dollars. Additional users beyond the plan minimum are billed at the same per user rate.
| Plan | Rate | What it includes |
|---|---|---|
| Starter | 175 dollars per user per month, annual subscription from 21,000 dollars a year, minimum 10 users. | Up to 3 data sources and 1,000 monitors. Metadata management, automated lineage, schema drift detection, data quality and observability, business glossary, API access, single sign on and role based access control, multi tenant hosting, email support. |
| Growth | 225 dollars per user per month, annual subscription from 54,000 dollars a year, minimum 20 users. | Up to 10 data sources and 3,000 monitors. Everything in Starter plus onboarding and training, a shared Slack or Microsoft Teams support channel, and priority support. |
| Enterprise | Custom, with volume pricing for large teams. | Unlimited data sources and monitors. Everything in Growth plus private cloud deployment, a dedicated customer success manager, custom onboarding, service level agreement and audit logs, and a custom master services agreement. |
| Add on: extra monitor | 0.59 dollars per monitor, pay as you go beyond the plan cap, no minimum commitment. | Available on all plans. |
| Add on: extra data source | 100 dollars per source per month, billed annually. | Available on all plans, for connectors beyond the plan limit. |
| Add on: single tenant hosting | 1,000 dollars per month, billed annually. | Dedicated infrastructure in an isolated environment. Growth and Enterprise plans only. |
Two definitions matter when you read that table. A monitor is one data quality or observability check run against a table or a column, so the monitor allowance is the number that scales with your estate rather than with your headcount. A data source is a connected system, so the source limit is what decides the plan for most teams before seat count does.
The reason those numbers are printed here is the same reason they are printed on the pricing page. A buyer can work out whether Decube is in their range before speaking to anyone, and can hold every other quote against a real comparison instead of a guess. If you want to work the other direction and size the cost of the problem first, the Decube ROI calculator estimates what bad data is costing you today.
What the published rate does not include is the same as for every other vendor here: your own implementation effort and the internal owner who runs the practice. That is not a pricing footnote, it is the difference between a platform that produces evidence and one that produces a login.
The evaluation itself is where most of the money is won or lost, because the quotes you receive are shaped by the brief you give. Six things to assess before you take a call.
| What to check | What to look at | Why it decides the cost |
|---|---|---|
| Fit with your actual shape | Current and projected data volume, source count, seat count and growth rate over three years. | It tells you which pricing model works with your shape instead of against it. |
| Core features you genuinely need | Which of discovery, lineage, quality monitoring and access enforcement is the reason you are buying. | Stops you paying for a tier bought on features you saw in a demo and will not use. |
| Total cost of ownership | Licence, implementation, support, infrastructure, internal staff time, over three years. | The licence is routinely under half of the three year total. |
| Integration and customisation | Whether every system on your list has a supported connector, named and versioned. | Missing connectors become professional services or an internal engineering project. |
| Support and service level | Which tier carries the response time, audit logs and service level agreement you need. | For regulated teams the compliance requirement usually forces the tier, not the feature set. |
| Trial or proof of concept | Whether you can run the tool on your own data before committing, and on which systems. | A pilot on the messiest domain is the only test that predicts the real cost. |
Then make the vendors quote the same thing. This is the step almost nobody takes and it is the one that produces comparable numbers.
Search Console shows people arriving at this page asking for a three year estimate covering licences, rollout and ongoing stewardship. Nobody can give you that number without your inputs, but the model below names every line so that you can fill it from quotes rather than from guesswork.
| Cost line | Year one | Years two and three | Where the number comes from |
|---|---|---|---|
| Platform licence | Full annual subscription. | Annual subscription plus the agreed increase. | The vendor quote, with the uplift written into the contract. |
| Implementation and professional services | The largest single addition to year one. | Small, unless you add domains or systems. | A separate fixed price quote with a defined scope, requested at the same time as the licence. |
| Connector work for unsupported systems | Whatever is on your list and not on theirs. | Maintenance as those systems change. | Your system list checked against the vendor connector list, name by name and version by version. |
| Internal ownership | Part or all of one role from day one. | The same role, continuing. | Your own salary bands. This is the line most three year models omit entirely. |
| Training and change management | At rollout. | Each new team onboarded. | Confirmed as inside the tier or quoted separately. |
| Infrastructure | Only for self hosted or private cloud deployments. | Continuing, and it grows with the estate. | Your cloud costs, plus any single tenant or private deployment premium. |
Two rules make that model reliable. Size every volume driven line for the estate you expect in year three rather than the one you have today, because that is when the tier boundary is crossed. And put the internal ownership line in, even at a fraction of a role, because leaving it out is what makes an open source option look free and a licensed platform look expensive.
Five mistakes account for most of the gap between what teams budget and what they spend.
The pricing question in this category has no single answer and does have a method. Count your sources and your assets before you speak to anyone. Decide which pricing model works with the shape of your team rather than against it. Write one scenario and make every vendor quote it. Add the four costs that are never on the quote. Then compare three year totals rather than year one licences.
That method also protects you from the thing this article deliberately refuses to do, which is print invented figures. A number without a vendor, a date and a source attached is worse than no number, because it feels like information and it will be wrong by the next quarter.
If proving how a reported number was produced is the reason you are buying, then the Decube data governance platform is priced in public and worth putting against the quotes you collect, because column level lineage is inside the plans rather than sold as a module. Request a demo and ask us to trace one of your own reports end to end. That is the test worth running on every vendor on your shortlist, including this one.
Five, and most quotes are one of them or a blend of two. Per user seats charge by headcount with access. Per data asset pricing charges by tables, datasets or columns under management. Consumption pricing charges for scans, records processed or monitors run. Platform tiers bundle limits and features into named plans. Module bundling sells a base catalog and charges separately for lineage, quality monitoring or access governance. The model matters more than the opening figure, because it decides whether your cost grows with your team, your data or your usage.
Tiers are usually built from four limits: how many data sources you can connect, how many assets or monitors are included, how many seats the plan covers, and which features are switched on. The comparison that matters is not the tier name but where each limit sits, because crossing one limit can cost more than everything below it. Ask every vendor for the price of the next tier up and the per unit price of exceeding a limit, so you can see the step before you hit it.
Enterprise licensing splits into three shapes. Annual subscriptions priced on seats or assets are the most common and the easiest to budget. Consumption licensing, used by Informatica and by Microsoft Purview through Azure, publishes a unit rate but cannot tell you your annual total. Perpetual or self hosted licensing still exists for regulated deployments and carries separate maintenance and infrastructure costs. Multi year commitments buy a discount and cost you the flexibility to change scale, so a one year term with a written renewal cap is often the better deal.
Discovery and metadata search sit at the lower end of this market because they are the base layer rather than the full platform. The cost rises when you add the things that make discovery governable: column level lineage, quality monitoring, policy enforcement and audit logging. If you compare a discovery only tool against a governance platform on price alone the discovery tool always wins, which is why the comparison has to start from which of those features you are actually required to produce.
Build it from six lines. The platform licence for three years including the agreed annual increase. Implementation and professional services, which land almost entirely in year one and are frequently the largest single addition to it. Connector work for any system the vendor does not support out of the box. Internal ownership, meaning part or all of a role from day one and continuing. Training and change management. Infrastructure, if the deployment is self hosted or private cloud. Size every volume driven line for the estate you expect in year three rather than the one you have today.
Atlan publishes a pricing page that names its tiers and does not state a rate, so every figure comes from a sales conversation. Quotes are built from seats and connected sources for your specific deployment. The variable worth pinning down in writing is lineage: depth varies by connector, so ask for the quote to name which of your systems get column level lineage at the quoted tier rather than accepting a total connector count. That position was checked on the Atlan pricing page in August 2026.
data.world publishes named plans without rates and quotes its enterprise tier, which puts it in the same position as Alation, Atlan, OvalEdge and Secoda: you can see the shape of the offer and not the number. What separates it commercially is that it is a knowledge graph rather than a conventional catalog, so it starts quickly and is lighter on policy enforcement and quality monitoring. Comparing it on plan price alone understates the total, because a plan that leaves enforcement to a second tool is not cheaper once the second tool is priced.
Cloud hosted catalogs are sold as annual subscriptions priced on seats, assets or consumption, and the vendor carries the infrastructure. Self hosted and private cloud deployments usually carry a premium on top of the subscription, because the vendor is supporting an environment it does not control, and you also carry the infrastructure and upgrade effort yourself. If a regulator requires your data to stay inside your own environment, price that requirement at the start of the evaluation rather than at contract stage, because it is one of the few things that is not negotiable.
Five, and none of them appears on the quote. Implementation and professional services, which land in the first three months. Internal engineer time to run the practice, which never stops. Connector development for any system the vendor does not support. Renewal uplift from month thirteen onward. Training and change management at rollout and with each new team. Ask for the implementation quote at the same time as the licence quote, and negotiate a written cap on the annual increase before you sign rather than after.
Decube publishes its rates rather than quoting them. As read from the Decube pricing page on 12 August 2026, the Starter plan is 175 United States dollars per user per month with an annual subscription from 21,000 dollars, a minimum of 10 users, up to 3 data sources and 1,000 monitors. The Growth plan is 225 dollars per user per month with an annual subscription from 54,000 dollars, a minimum of 20 users, up to 10 data sources and 3,000 monitors. Enterprise is custom with volume pricing, unlimited sources and monitors and private cloud deployment. Add ons are priced at 0.59 dollars per extra monitor, 100 dollars per extra data source per month, and 1,000 dollars a month for single tenant hosting. All plans are billed annually.

First step to AI Readiness
Table of Contents
Sneak peek from the data world.


Bring lineage, quality, governance, and AI together in one platform—so your teams and AI agents can act with confidence.
_For%20light%20backgrounds.svg)
.svg)




.webp)