Is Atlan worth it?
Atlan is worth it if your primary need is a modern data catalog with strong column-level lineage and cloud-native integrations (Snowflake, dbt, Databricks). It is harder to justify if you also need data observability and quality coverage across a heterogeneous stack — those capabilities require separate vendors, adding cost and complexity.
What is the best Atlan alternative
Decube is purpose-built for regulated financial services, with native observability, approval-gated lineage, PII auto-classification, and an AI layer (TrustyAI) that does not route metadata to a public LLM. These map directly to regulatory frameworks supervised by MAS, OJK, BNM, and APRA. Atlan AI's OpenAI dependency is often a procurement blocker in these environments.
How does Atlan compare to Alation?
Both are catalog-first platforms with strong discovery. Alation pioneered search-first data culture and analyst adoption. Atlan is stronger on column-level lineage and cloud integrations. Both require external tooling for observability and broad data quality coverage.
How long does it take to migrate from Atlan to another platform?
Migration time depends on estate size and the number of active integrations. SaaS-native platforms like Decube deploy in 2–6 weeks without professional services. The longer task is typically re-establishing business glossaries, data ownership, and custom attributes — that effort is roughly the same regardless of which platform you move to.
What is the difference between a context layer and a semantic layer?
A semantic layer standardizes how metrics are defined and calculated so every analyst and BI tool uses the same numbers. A context layer encodes governance rules, data lineage, quality signals, and organizational knowledge so AI agents can make safe, autonomous decisions. The semantic layer is for human-facing analytics. The context layer is for AI-facing autonomy.
Can I use a semantic layer without a context layer?
Yes - and most organizations do today. If your primary consumers are human analysts using BI tools, a semantic layer alone is sufficient. The context layer becomes essential when you introduce AI agents that need to understand not just what a metric means but whether and how they are allowed to use it.
Is a context layer the same as a data catalog?
No. A data catalog is a component of a context layer. The catalog inventories data assets and stores metadata. The context layer activates that metadata by delivering it to AI agents at query time through APIs and MCP connections. Modern platforms like Atlan extend catalog functionality into full context layer infrastructure.
Which tool implements a context layer?
Purpose-built context layer platforms include Decube, which combines catalog, lineage, quality, and governance into a metadata layer that delivers context to AI agents via MCP. You can also build a context layer on custom infrastructure using a vector database (for semantic search), a knowledge graph
How long does it take to implement a context layer?
Most enterprise context layer implementations take 8–16 weeks when using a purpose-built platform like Atlan. Building from scratch on custom infrastructure typically takes 6–12 months. The timeline depends heavily on how much governance metadata already exists and how many data sources need to be connected.
What is Data Context?
Data Context is the information that explains what data means, where it comes from, how it is transformed, whether it can be trusted, and how it should be used. It combines metadata, lineage, data quality, and governance so people and systems can confidently use data for analytics, reporting, and AI.
How is Data Context different from metadata?
Metadata describes data, while Data Context makes data usable and trustworthy. Metadata provides definitions, ownership, and technical details. Data Context extends this by adding lineage, quality signals, and governance rules, creating a complete, operational understanding of data.
Why is Data Context important for AI?
AI systems require Data Context to interpret data correctly, safely, and reliably. Without context, AI models may misunderstand metrics, use stale or incorrect data, or expose sensitive information. Data Context ensures AI uses trusted, well-defined, and policy-compliant data.
How does data lineage contribute to Data Context?
Data lineage provides visibility into how data flows and transforms across systems. It shows upstream sources, downstream dependencies, and transformation logic, enabling impact analysis, root-cause investigation, and confidence in reported numbers.
How do organizations build Data Context in practice?
Organizations build Data Context by unifying metadata, lineage, observability, and governance into a single operational layer. This includes defining business meaning, capturing end-to-end lineage, monitoring data quality, and enforcing usage policies directly within data workflows.
What is Context Engineering?
Context Engineering is the practice of designing and operationalizing business meaning, data lineage, quality signals, ownership, and policy constraints so that both humans and AI systems can reliably understand and act on enterprise data. Unlike traditional metadata management, Context Engineering focuses on decision-grade context that can be consumed programmatically by AI agents in real time.
How is Context Engineering different from prompt engineering?
Prompt engineering focuses on how questions are phrased for an AI model, while Context Engineering focuses on what the AI system already knows before a question is asked. In enterprise environments, context includes data definitions, lineage, quality, and usage constraints—making Context Engineering foundational for trustworthy and scalable Agentic AI.
Why is Context Engineering critical for Agentic AI?
Agentic AI systems reason, decide, and act autonomously across multiple systems. Without engineered context—such as trusted data meaning, lineage, and real-time quality signals—agents cannot assess risk or impact correctly. Context Engineering ensures AI agents act safely, explain decisions, and know when to pause or escalate.
What are the core components of Context Engineering?
The four core components of Context Engineering are: Semantic context (business meaning and definitions) Lineage context (end-to-end data flow and dependencies) Operational context (data quality and reliability signals) Policy context (privacy, compliance, and usage constraints) Together, these form a unified context layer that supports enterprise decision-making and AI automation
How should enterprises prepare for Context Engineering?
Enterprises should follow a phased approach: Inventory critical data and trust gaps Unify metadata, lineage, quality, and policy into a single context layer Expose context through APIs for AI agent consumption By 2026, this foundation will be essential for deploying Agentic AI at scale with confidence and auditability.
How do you measure the ROI of a data catalog?
ROI is measured by comparing the quantifiable benefits (such as reduced data search time, fewer data quality issues, and lower compliance effort) against the total costs (implementation, licensing, and support). Typical metrics include time savings, productivity gains, and compliance cost reduction.
What is a data catalog and why is it important for ROI?
A data catalog is a centralized inventory of data assets enriched with metadata that helps users find, understand, and trust data across an organization. It improves data discovery, reduces search time, and enhances collaboration — all of which contribute to measurable ROI by cutting operational costs and accelerating insights.
How quickly can businesses see ROI after implementing a data catalog?
Time-to-value varies with deployment and adoption, but many organizations begin seeing measurable improvements in days to months, especially through faster data discovery and reduced compliance effort. Early wins in these areas can quickly justify the investment.
What factors should you include when calculating the ROI of a data catalog?
When calculating ROI, include: Implementation and training costs Recurring maintenance and licensing fees Savings from reduced data search and rework Compliance cost reductions Productivity and decision-making improvements This ensures a holistic view of both costs and benefits.
How does a data catalog support data governance and compliance ROI?
A data catalog enhances governance by classifying data, enforcing rules, and providing transparency. This reduces regulatory risk and compliance effort, leading to direct cost savings and stronger data trust.
What is data lineage?
Data lineage shows where data comes from, how it moves, and how it changes across systems. It helps teams understand the full journey of data—from source to final reports or AI models.
Why is data lineage important for modern data teams?
Data lineage builds trust in data by making it transparent and explainable. It helps teams troubleshoot issues faster, assess impact before changes, meet compliance requirements, and confidently use data for analytics and AI.
What are the different types of data lineage?
Common types of data lineage include: Technical lineage – Tracks data movement at table and column level. Business lineage – Connects data to business definitions and metrics. Operational lineage – Shows how pipelines and jobs process data. End-to-end lineage – Combines all of the above across systems.
Is data lineage only useful for compliance?
No. While data lineage is critical for audits and regulatory compliance, it is equally valuable for debugging data issues, impact analysis, cost optimization, and AI readiness.
How does data lineage help with data quality?
Data lineage helps identify where data quality issues originate and which reports or dashboards are affected. This reduces time spent on root-cause analysis and improves accountability across data teams.
What is Metadata Management?
Metadata management involves the management and organization of data about data to enhance data governance, data asset quality, and compliance.
What are the key points of Metadata Management?
Metadata management involves defining a metadata strategy, establishing roles and policies, choosing the right metadata management tool, and maintaining an ongoing program.
How does Metadata Management work?
Metadata management is essential for improving data quality and relevance, utilizing metadata management tools, and driving digital transformation.
Why is Metadata Management important for businesses?
Metadata management is important for better data quality, usability, data insights, compliance adherence, and improved accuracy in data cataloging.
How should companies evolve their approach to Metadata Management?
Companies should manage all types of metadata across different environments, leverage intelligent methods, and follow best practices to maximize data investments.
What is a data definition example?
A data definition example could be: “Customer: a person or entity that has made at least one purchase within the past year.” It clearly sets business meaning and inclusion criteria.
Why is data definition important in data governance?
It ensures everyone interprets data consistently, reducing ambiguity and improving compliance, reporting, and collaboration.
Who should own data definitions?
Ownership should be shared between business domain experts (for context) and data stewards (for technical accuracy).
How often should data definitions be reviewed?
Ideally quarterly or whenever there’s a structural change in business logic, data models, or product offerings.
What’s the difference between data definition and data catalog?
A data catalog inventories data assets; data definition explains what those assets mean. Combined, they create full visibility and trust.
Why is Data Lineage important for businesses?
Data Lineage provides transparency and trust in your data ecosystem. It helps organizations ensure data accuracy, simplify root-cause analysis during data quality issues, and maintain compliance with regulations like GDPR or SOX. By understanding data flows, teams can make faster, more reliable decisions and improve overall data governance.
What are the key components of Data Lineage?
The main components of Data Lineage include: Data Sources: Where the data originates (databases, APIs, files). Transformations: How data is processed or modified. Data Pipelines: The tools or systems that move data. Destinations: Where the data is stored or consumed (dashboards, reports, models). Metadata: The contextual details that describe each step in the data’s lifecycle.
How does Data Lineage support Data Governance and AI readiness?
Data Lineage acts as the foundation for strong data governance by providing visibility into data ownership, transformation logic, and usage. For AI initiatives, lineage ensures that models are trained on accurate and traceable data, making AI outputs more explainable and trustworthy. Platforms like Decube’s Data Trust Platform unify lineage with data quality and metadata management to help enterprises achieve AI readiness.
What tools are commonly used for Data Lineage?
Several tools help automate and visualize data lineage, such as Decube, Atlan, Alation, Collibra, and OpenLineage. These tools connect to data warehouses, ETL pipelines, and BI tools to automatically map relationships between datasets — saving time and reducing manual effort.
What is Data Lineage?
Data Lineage is the process of tracking how data moves and transforms across an organization — from its origin to its final destination. It shows where data comes from, how it changes through different systems or pipelines, and where it ends up being used. In short, data lineage helps you visualize the journey of your data.
What does “data context” mean?
Data context refers to the semantic, structural, and business information that surrounds raw data. It explains what data means, where it comes from, who owns it, and how it should be used.
What is a centralized LLM framework?
It’s an enterprise-wide system where all departments access AI through a shared platform, equipped with guardrails, context layers, and multimodal capabilities.
What are guardrails in AI?
Guardrails are controls—policies, access restrictions, and compliance checks—that ensure AI outputs are secure, ethical, and aligned with enterprise goals.
How does data context affect ROI in AI?
Models trained or prompted with contextualized data deliver outputs that are relevant, trustworthy, and actionable—leading to faster adoption and higher business value.
What is MCP (Model Context Protocol) and why does it matter?
MCP defines how models interact with external tools and data sources. Feeding it with strong context ensures the AI agent can act accurately and responsibly.
What is a Data Trust Platform in financial services?
A Data Trust Platform is a unified framework that combines data observability, governance, lineage, and cataloging to ensure financial institutions have accurate, secure, and compliant data. In banking, it enables faster regulatory reporting, safer AI adoption, and new revenue opportunities from data products and APIs.
Why do AI initiatives fail in Latin American banks and fintechs?
Most AI initiatives in LATAM fail due to poor data quality, fragmented architectures, and lack of governance. When AI models are fed stale or incomplete data, predictions become inaccurate and untrustworthy. Establishing a Data Trust Strategy ensures models receive fresh, auditable, and high-quality data, significantly reducing failure rates.
What are the biggest data challenges for financial institutions in LATAM?
Key challenges include: Data silos and fragmentation across legacy and cloud systems. Stale and inconsistent data, leading to poor decision-making. Complex compliance requirements from regulators like CNBV, BCB, and SFC. Security and privacy risks in rapidly digitizing markets. AI adoption bottlenecks due to ungoverned data pipelines.
How can banks and fintechs monetize trusted data?
Once data is governed and AI-ready, institutions can: Reduce OPEX with predictive intelligence. Offer hyper-personalized products like ESG loans or SME financing. Launch data-as-a-product (DaaP) initiatives with anonymized, compliant data. Build API-driven ecosystems with partners and B2B customers.
What is data dictionary example?
A data dictionary is a centralized repository that provides detailed information about the data within an organization. It defines each data element—such as tables, columns, fields, metrics, and relationships—along with its meaning, format, source, and usage rules. Think of it as the “glossary” of your data landscape. By documenting metadata in a structured way, a data dictionary helps ensure consistency, reduces misinterpretation, and improves collaboration between business and technical teams. For example, when multiple teams use the term “customer ID”, the dictionary clarifies exactly how it is defined, where it is stored, and how it should be used. Modern platforms like Decube extend the concept of a data dictionary by connecting it directly with lineage, quality checks, and governance—so it’s not just documentation, but an active part of ensuring data trust across the enterprise.
What is an MCP Server?
An MCP Server stands for Model Context Protocol Server—a lightweight service that securely exposes tools, data, or functionality to AI systems (MCP clients) via a standardized protocol. It enables LLMs and agents to access external resources (like files, tools, or APIs) without custom integration for each one. Think of it as the “USB-C port for AI integrations.”
How does MCP architecture work?
The MCP architecture operates under a client-server model: MCP Host: The AI application (e.g., Claude Desktop or VS Code). MCP Client: Connects the host to the MCP Server. MCP Server: Exposes context or tools (e.g., file browsing, database access). These components communicate over JSON‑RPC (via stdio or HTTP), facilitating discovery, execution, and contextual handoffs.
Why does the MCP Server matter in AI workflows?
MCP simplifies access to data and tools, enabling modular, interoperable, and scalable AI systems. It eliminates repetitive, brittle integrations and accelerates tool interoperability.
How is MCP different from Retrieval-Augmented Generation (RAG)?
Unlike RAG—which retrieves documents for LLM consumption—MCP enables live, interactive tool execution and context exchange between agents and external systems. It’s more dynamic, bidirectional, and context-aware.
What is a data dictionary?
A data dictionary is a centralized repository that provides detailed information about the data within an organization. It defines each data element—such as tables, columns, fields, metrics, and relationships—along with its meaning, format, source, and usage rules. Think of it as the “glossary” of your data landscape. By documenting metadata in a structured way, a data dictionary helps ensure consistency, reduces misinterpretation, and improves collaboration between business and technical teams. For example, when multiple teams use the term “customer ID”, the dictionary clarifies exactly how it is defined, where it is stored, and how it should be used. Modern platforms like Decube extend the concept of a data dictionary by connecting it directly with lineage, quality checks, and governance—so it’s not just documentation, but an active part of ensuring data trust across the enterprise.
What is the purpose of a data dictionary?
The primary purpose of a data dictionary is to help data teams understand and use data assets effectively. It provides a centralized repository of information about the data, including its meaning, origins, usage, and format, which helps in planning, controlling, and evaluating the collection, storage, and use of data.
What are some best practices for data dictionary management?
Best practices for data dictionary management include assigning ownership of the document, involving key stakeholders in defining and documenting terms and definitions, encouraging collaboration and communication among team members, and regularly reviewing and updating the data dictionary to reflect any changes in data elements or relationships.
How does a business glossary differ from a data dictionary?
A business glossary covers business terminology and concepts for an entire organization, ensuring consistency in business terms and definitions. It is a prerequisite for data governance and should be established before building a data dictionary. While a data dictionary focuses on technical metadata and data objects, a business glossary provides a common vocabulary for discussing data.
What is the difference between a data catalog and a data dictionary?
While a data catalog focuses on indexing, inventorying, and classifying data assets across multiple sources, a data dictionary provides specific details about data elements within those assets. Data catalogs often integrate data dictionaries to provide rich context and offer features like data lineage, data observability, and collaboration.
What challenges do organizations face in implementing data governance?
Common challenges include resistance from business teams, lack of clear ownership, siloed systems, and tool fragmentation. Many organizations also struggle to balance strict governance with data democratization. The right approach involves embedding governance into workflows and using platforms that unify governance, observability, and catalog capabilities.
How does data governance impact AI and machine learning projects?
AI and ML rely on high-quality, unbiased, and compliant data. Poorly governed data leads to unreliable predictions and regulatory risks. A governance framework ensures that data feeding AI models is trustworthy, well-documented, and traceable. This increases confidence in AI outputs and makes enterprises audit-ready when regulations apply.
What is data governance and why is it important?
Data governance is the framework of policies, ownership, and controls that ensure data is accurate, secure, and compliant. It assigns accountability to data owners, enforces standards, and ensures consistency across the organization. Strong governance not only reduces compliance risks but also builds trust in data for AI and analytics initiatives.
What is the difference between a data catalog and metadata management?
A data catalog is a user-facing tool that provides a searchable inventory of data assets, enriched with business context such as ownership, lineage, and quality. It’s designed to help users easily discover, understand, and trust data across the organization. Metadata management, on the other hand, is the broader discipline of collecting, storing, and maintaining metadata (technical, business, and operational). It involves defining standards, policies, and processes for metadata to ensure consistency and governance. In short, metadata management is the foundation—it structures and governs metadata—while a data catalog is the application layer that makes this metadata accessible and actionable for business and technical users.
What features should you look for in a modern data catalog?
A strong catalog includes metadata harvesting, search and discovery, lineage visualization, business glossary integration, access controls, and collaboration features like data ratings or comments. More advanced catalogs integrate with observability platforms, enabling teams to not only find data but also understand its quality and reliability.
Why do businesses need a data catalog?
Without a catalog, employees often struggle to find the right datasets or waste time duplicating efforts. A data catalog solves this by centralizing metadata, providing business context, and improving collaboration. It enhances productivity, accelerates analytics projects, reduces compliance risks, and enables data democratization across teams.
What is a data catalog and how does it work?
A data catalog is a centralized inventory that organizes metadata about data assets, making them searchable and easy to understand. It typically extracts metadata automatically from various sources like databases, warehouses, and BI tools. Users can then discover datasets, understand their lineage, and see how they’re used across the organization.
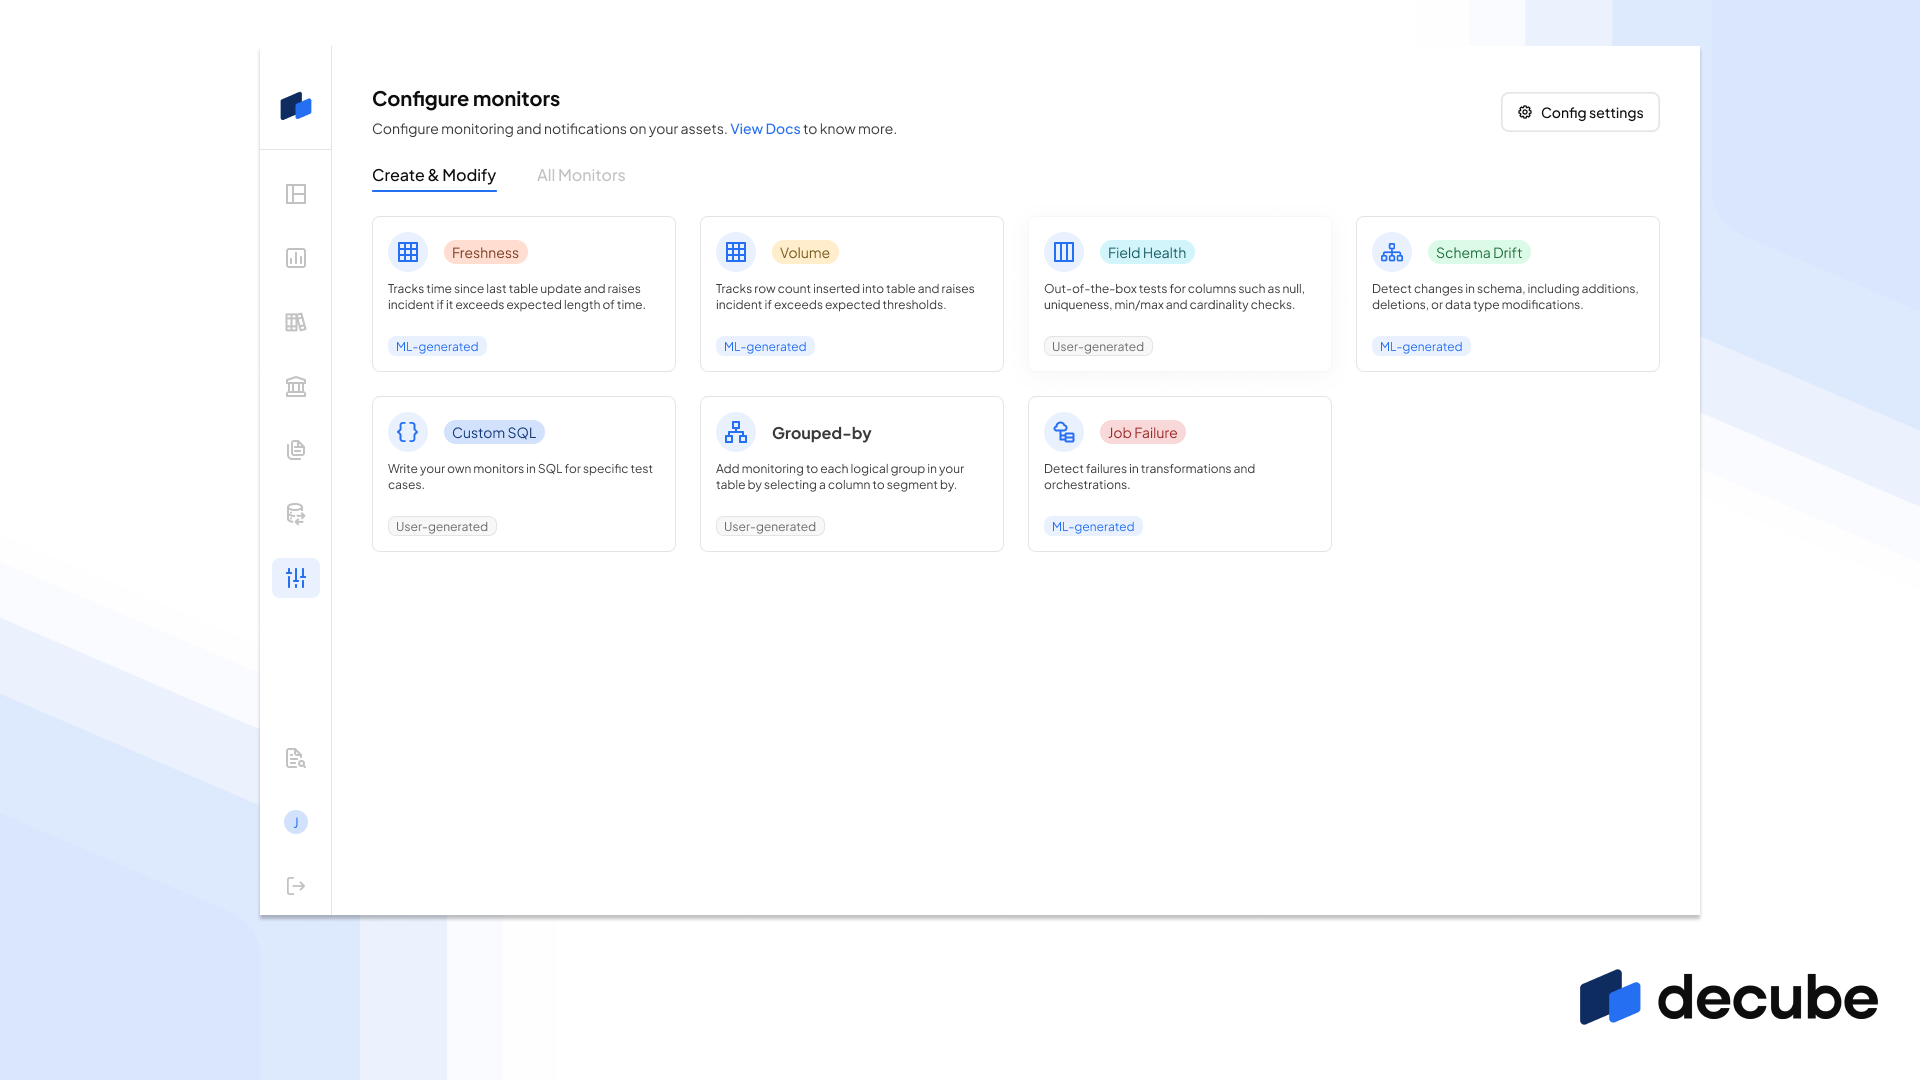
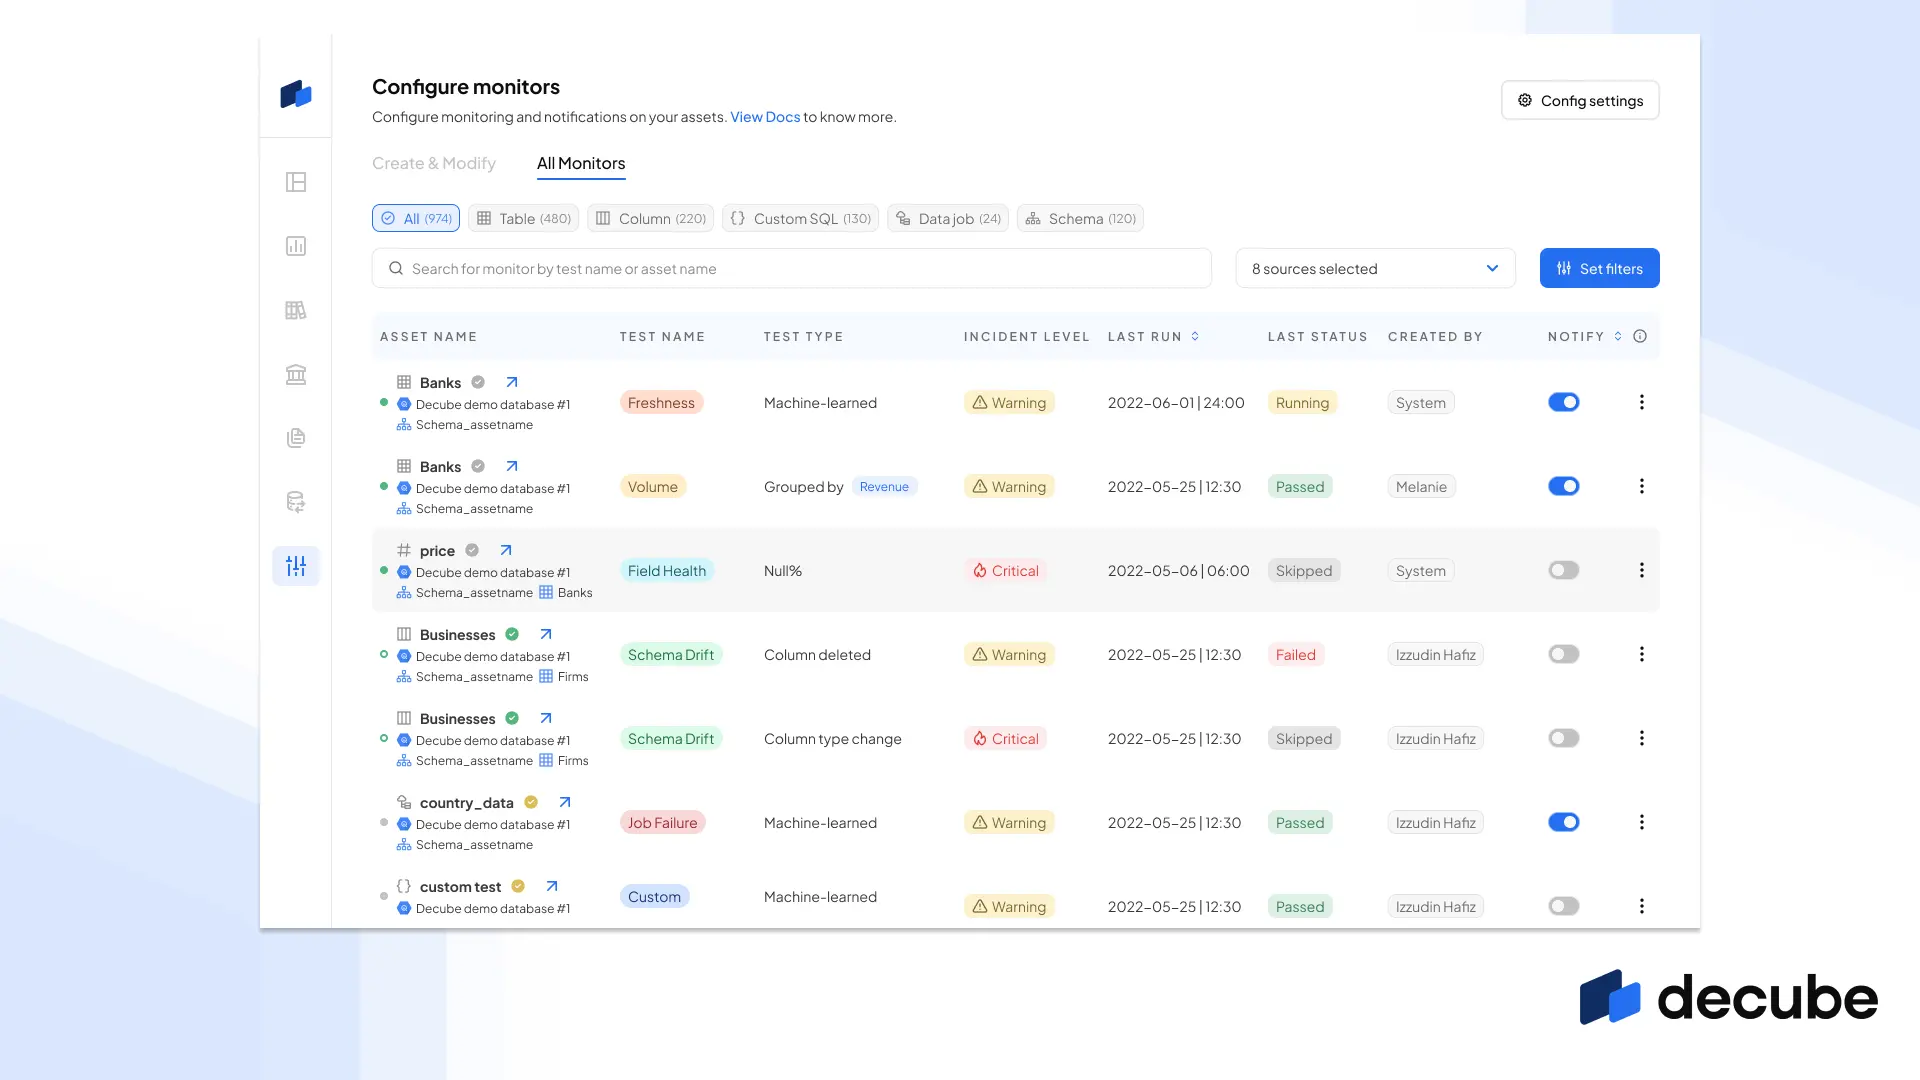
What are the key features of a data observability platform?
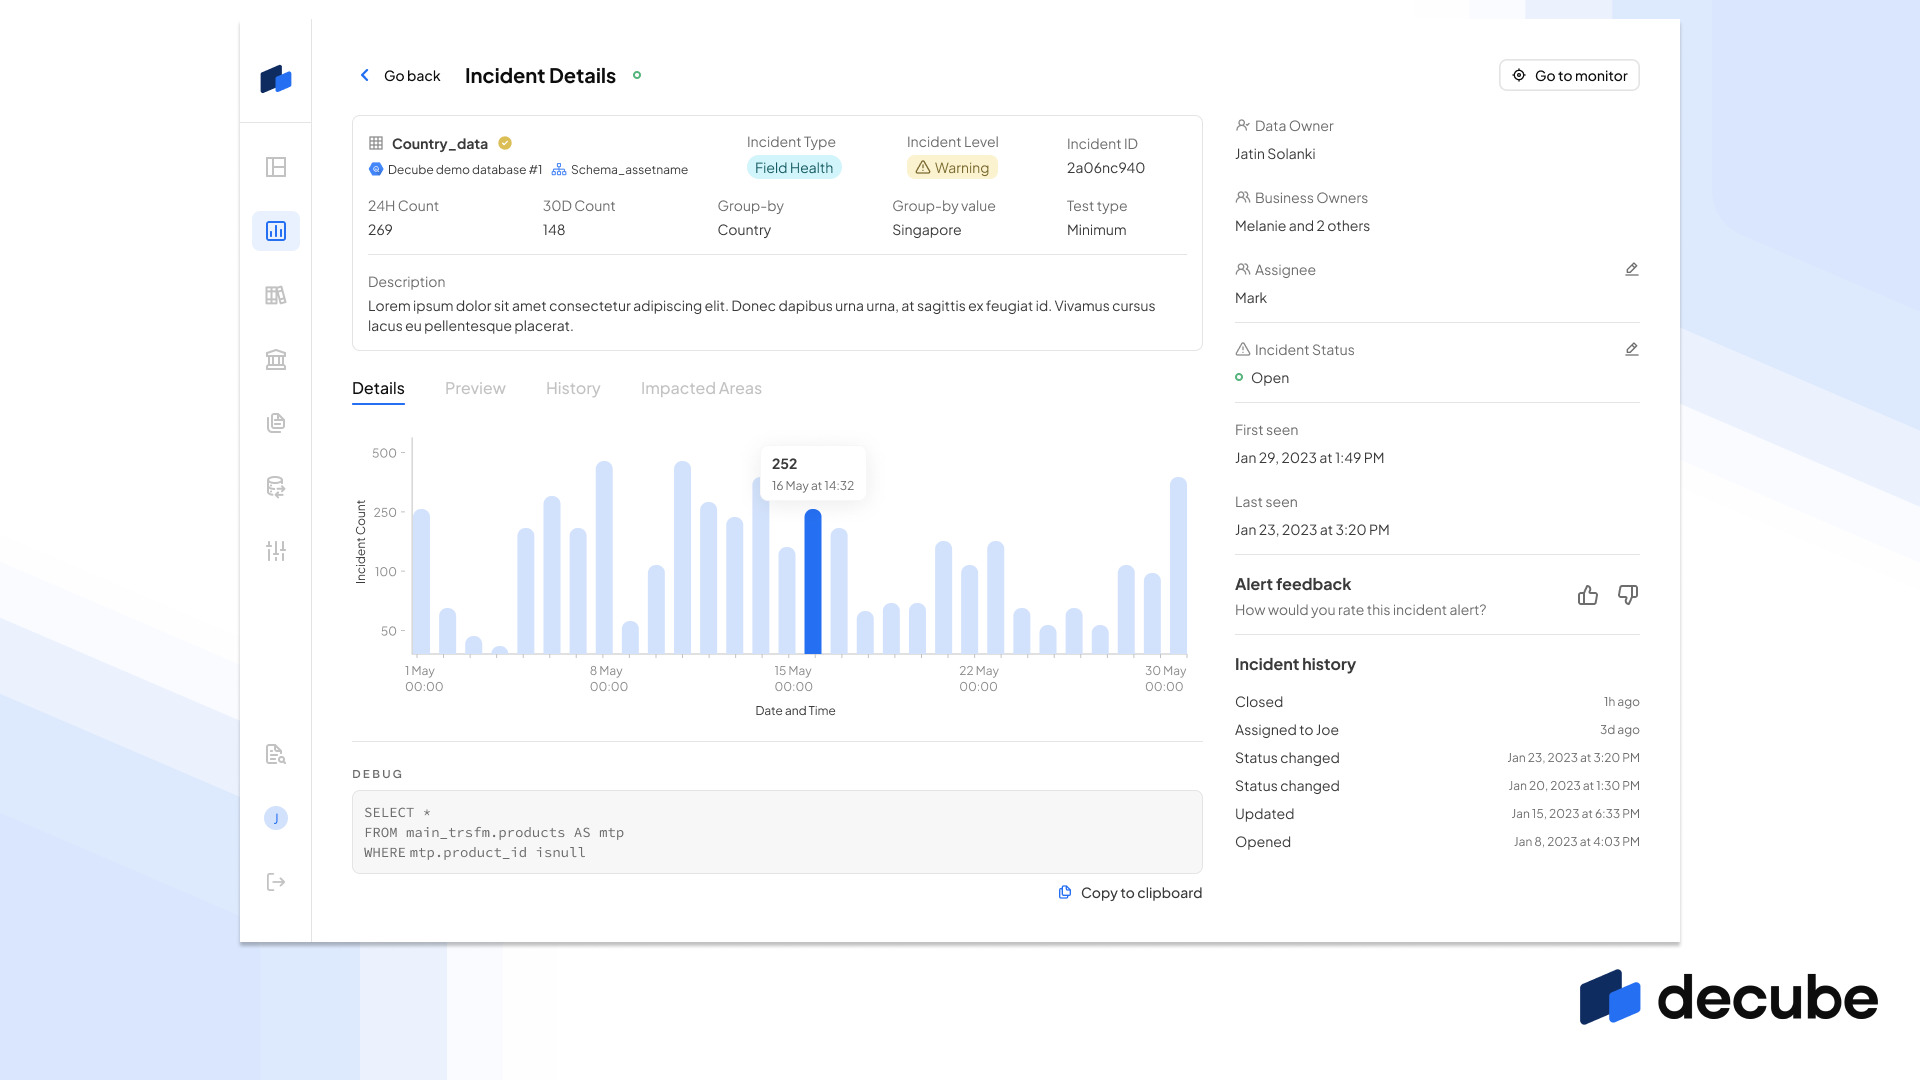
Modern platforms include anomaly detection, schema and freshness monitoring, end-to-end lineage visualization, and alerting systems. Some also integrate with business glossaries, support SLA monitoring, and automate root cause analysis. Together, these features provide a holistic view of both technical data pipelines and business data quality.
How is data observability different from data monitoring?
Monitoring typically tracks system metrics (like CPU usage or uptime), whereas observability provides deep visibility into how data behaves across systems. Observability answers not only “is something wrong?” but also “why did it go wrong?” and “how does it impact downstream consumers?” This makes it a foundational practice for building AI-ready, trustworthy data systems.
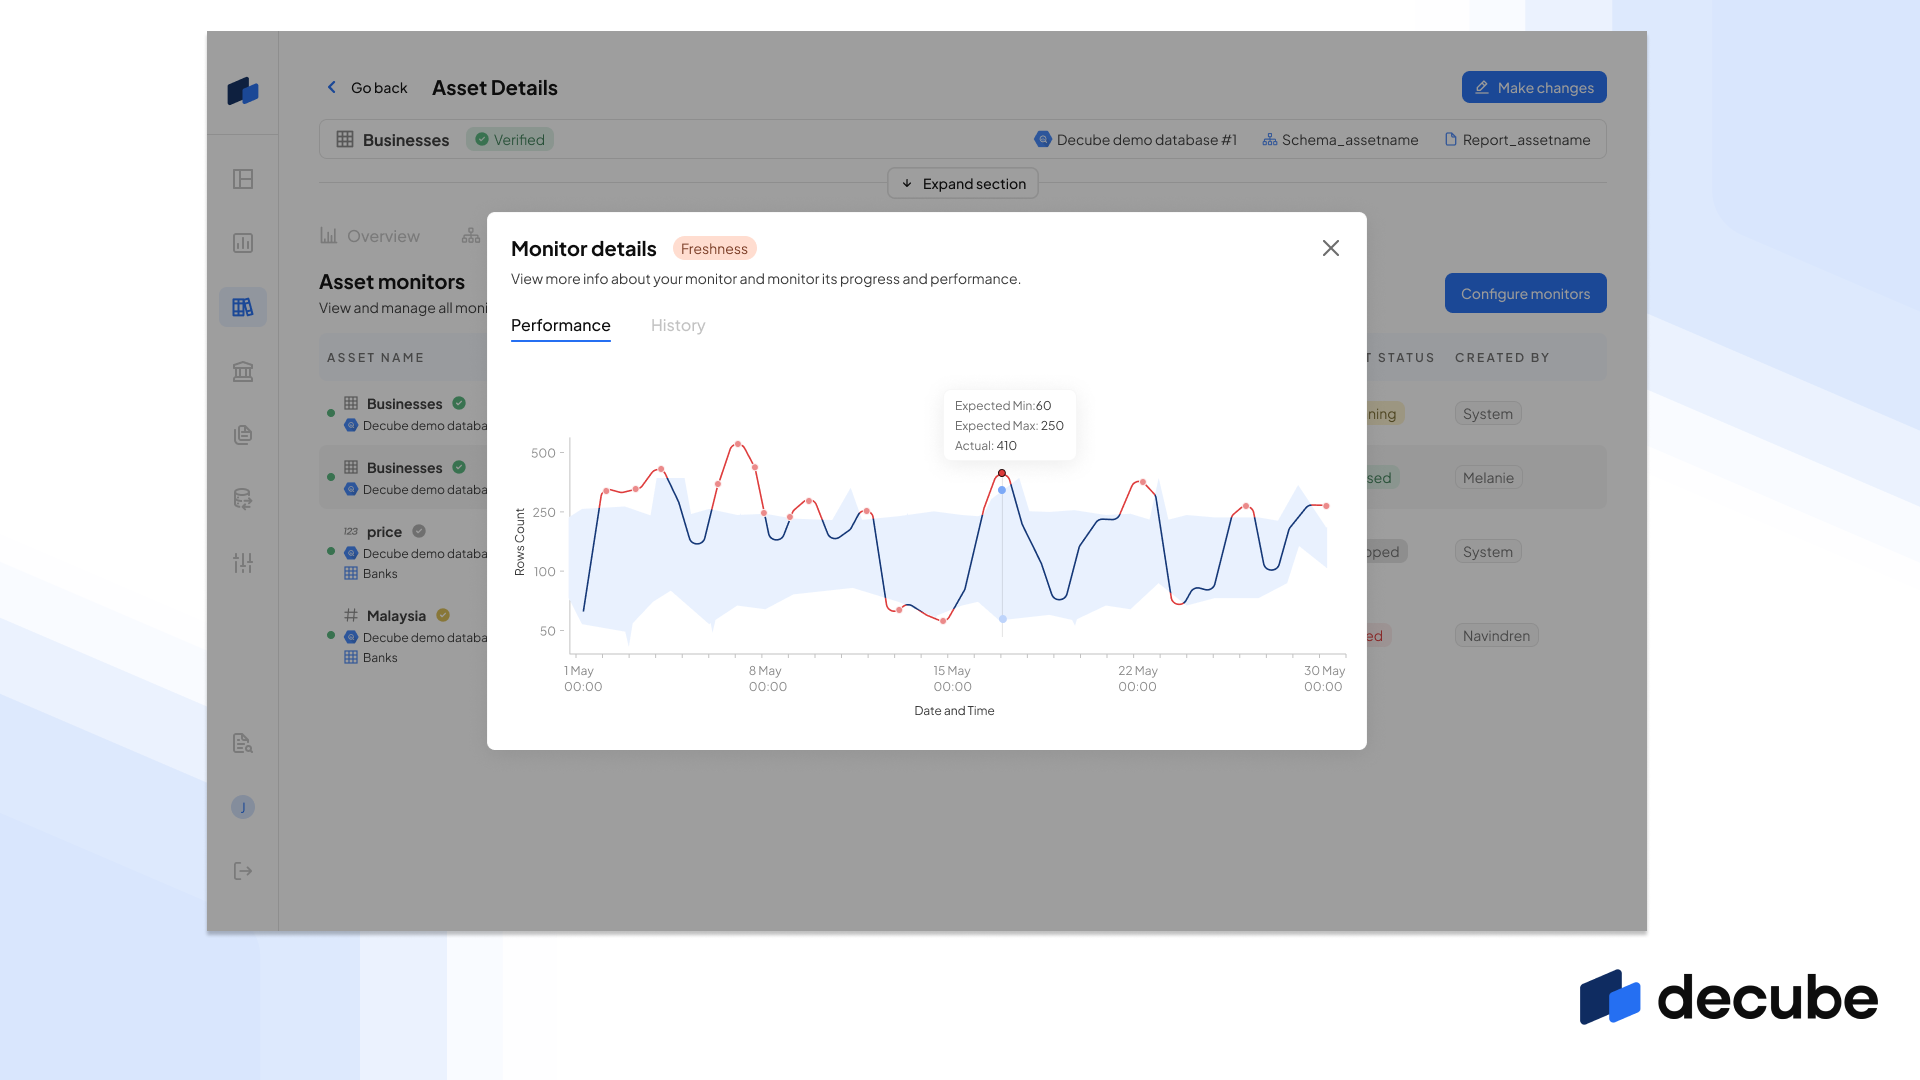
What are the key pillars of Data Observability?
The five common pillars include: Freshness, Volume, Schema, Lineage, and Quality. Together, they provide a 360° view of how data flows and where issues might occur.
What is Data Observability and why is it important?
Data observability is the practice of continuously monitoring, tracking, and understanding the health of your data systems. It goes beyond simple monitoring by giving visibility into data freshness, schema changes, anomalies, and lineage. This helps organizations quickly detect and resolve issues before they impact analytics or AI models. For enterprises, data observability builds trust in data pipelines, ensuring decisions are made with reliable and accurate information.


_For%20light%20backgrounds.svg)