
Enroll to explore sandbox
Kindly fill up the following to try out our sandbox experience. We will get back to you at the earliest.
Kindly fill up the following to try out our sandbox experience. We will get back to you at the earliest.
AI learns what normal looks like. Rules state what correct is. The decision rule, the false positive arithmetic, and when traditional checks still win.

Updated on
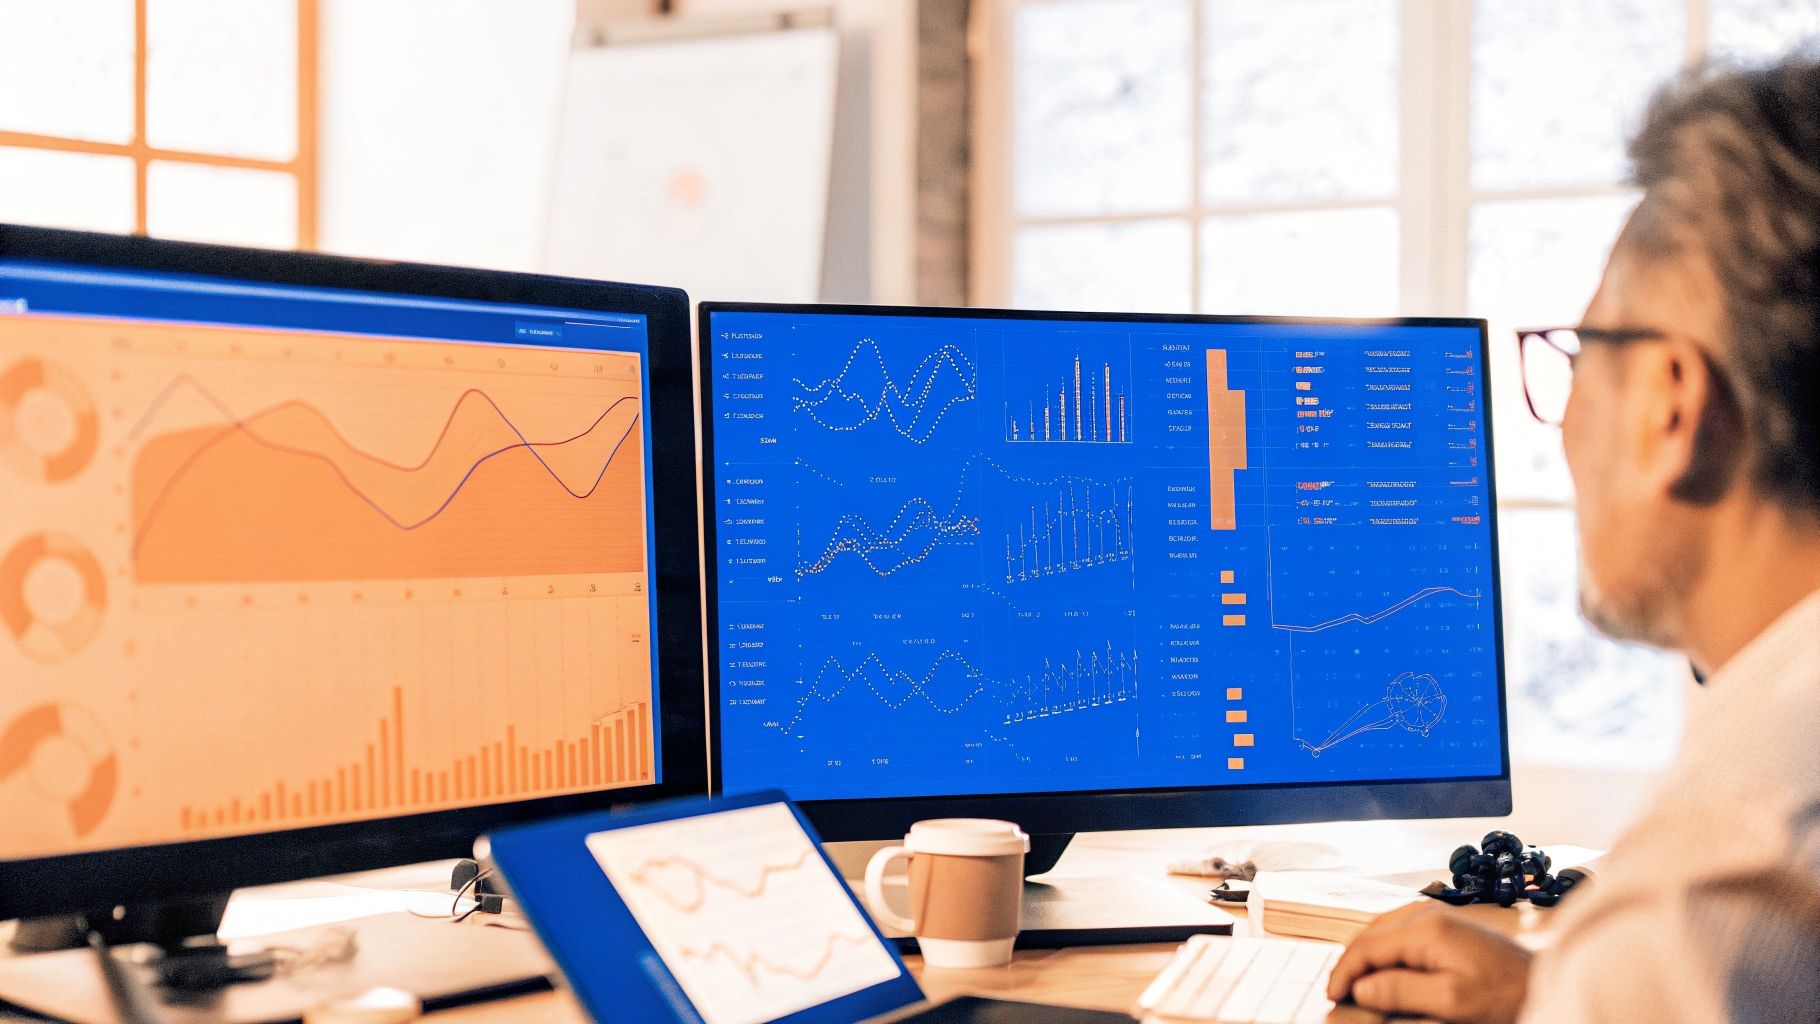
AI driven data quality solutions learn what normal behavior looks like for a dataset and raise an incident when the current behavior sits outside that learned range. Traditional data quality methods state a condition the data must satisfy and raise an incident when the condition fails. The first approach gives you coverage everywhere and an approximate answer. The second gives you an exact answer about a small number of things you thought of in advance.
That gives a decision rule, and it is the only one you need to start with. If you can write down the correct answer, write a rule. If you can only describe what normal looks like, train a monitor. A country code column has a correct answer, so it gets a rule against the ISO list. Yesterday's order volume has no correct answer, only a range that has held for the last few months, so it gets a learned band.
Traditional techniques use fixed thresholds while AI systems adapt to changing trends, and that is accurate as far as it goes. What it left out is that adapting is not always an improvement. A threshold that moves is a threshold that quietly accepts a slow drift, and a slow drift is how most quality problems actually arrive. If your null rate on a required field climbs from two percent to nine percent over four months, a learned band will have followed it the whole way and never fired. A rule that says the null rate must stay under three percent fires on the day it crosses.
Neither approach is the modern one. They answer different questions, and a real deployment runs both. If what you want first is the general explainer rather than the comparison, our page on data quality management covers the discipline end to end and this page assumes it.
| What you are asking | Traditional rules | AI driven monitors |
|---|---|---|
| The claim it can make | This value is wrong | This value is unusual |
| Coverage | Only the checks somebody wrote | Every table and metric it is pointed at |
| Setup effort | High and permanent, one check at a time | Low after connection, most monitors configure themselves |
| Works on a brand new table | Yes | No |
| Catches a slow drift | Yes, the threshold does not move | No, the band moves with it |
| Catches something nobody predicted | No | Yes |
| Explains itself to an auditor | Yes, the rule is the documentation | Partial, you can show the band but not the reasoning |
| Error mode when it goes wrong | Silence, because the check was never written | Noise, because the band flags ordinary change |
| Cost of scale | Engineer hours writing and maintaining checks | Monitor count and triage time on false alerts |
Four separate things are sold under this phrase, and they are worth very different amounts. Separating them is the fastest way to work out whether a demo is showing you engineering or a slide.
A product that does the first two well is worth paying for. A product whose entire AI story is the third is selling you a lineage graph with a chat box attached. A product that claims the fourth without an approval step is a compliance problem you have not discovered yet.
The split shows up in the monitor list of any observability platform. In Decube, schema drift and job failure monitors switch on the moment a source is connected, freshness and volume monitors learn each table's own update pattern and row count behavior, and field health and custom SQL monitors are written rules that you define. The video below walks through each monitor type and how to choose between them.
| What is sold as AI | What it actually does | Verdict |
|---|---|---|
| Learned thresholds | Sets the alerting range from the table's own history | Genuinely useful |
| Check suggestion | Proposes rules from profiling results | Useful with an approval gate |
| Incident triage | Reads lineage and narrates the blast radius | Time saving, not a verdict |
| Automatic correction | Rewrites values a model judged implausible | Marketing unless a person approves each write |
Four advantages hold up. They are worth stating precisely rather than generally, because the precision is what tells you whether they apply to your estate.
One number the original article carried has been removed rather than repeated. It claimed organizations using AI achieve a 40 percent productivity increase and a 48 percent improvement in output quality. That pair traces back through the page's own source list to a vendor blog attributing them to Harvard Business Review in 2021, as a general statement about AI and efficiency with nothing to do with data quality tooling. A borrowed figure about something else is not evidence, so it is gone and the advantages above stand on what they actually do.
The original article named three challenges and they are all real: the outputs are only as good as the data the models learn from, integration with existing management systems disrupts established workflows, and the complexity of the algorithms makes the decision path hard to see. Two more belong on the list, and they are the two that decide whether a deployment survives its second quarter.
The first is that the model has no idea what your business did last Tuesday. A learned monitor on order volume cannot distinguish a broken pipeline from a public holiday, a price change or a partner going live. Every one of those is a deviation from the learned range and every one of them produces an alert somebody has to read and dismiss.
The second is that you cannot show an auditor a learned band and call it a control. You can show the band, the history behind it and the alerts it raised, and that is genuinely useful evidence. What you cannot do is state the criterion the data had to meet, because there was not one. For anything a regulator asks about, the criterion has to be written down.
A third claim on the original page has been removed. It said a survey revealed that 81 percent of companies struggle with the accuracy of their technology driven initiatives, and it named no survey, no publisher and no year. The point it was making, that poor input data undermines AI outputs, is true without it.
This is the number no vendor page states, and it is the one that decides whether your team still reads the alert channel in month six. You can work it out yourself in two lines of arithmetic.
A learned band drawn at the 99th percentile of historical behavior flags roughly one run in a hundred by construction, even when the data is perfect, because that is what the percentile means. On a table that loads once a day, that is about 3.7 alerts a year from a single monitor with nothing wrong. Put two thousand such monitors on daily tables and the arithmetic gives 7,300 expected false alerts a year, which across 250 working days is about 29 every working day before a single genuine incident occurs.
Tighten the band to the 99.9th percentile and the same arithmetic gives about 2.9 a day, which is liveable. You have also just told the system to ignore every deviation smaller than a one in a thousand event, and in most estates the deviations that caused last year's incidents were nowhere near that large. That trade is the whole game, and no setting escapes it.
The working limit we apply is one unexplained alert per on call engineer per working day. Above that, people stop reading the channel, and a monitor nobody reads protects nobody. If your platform cannot get under that limit with a band tight enough to catch real problems, the answer is fewer monitors on the tables that matter rather than more monitors everywhere. Deciding which alerts deserve a person at all is easier once you are clear on how data quality and data observability differ, because they answer different questions and only one of them should be waking someone up.
Grouping helps as well as tuning. Decube consolidates notifications rather than sending one message per firing monitor, and routes them to email or Slack with severity levels, so a single upstream failure that trips forty downstream monitors arrives as one thing to read. Alert routing does not reduce the false positive rate, but it does decide whether the rate is survivable, and it is worth building a culture that reads them before you widen coverage any further.
A learned threshold is learned from history. A table with no history has nothing to learn from, so for its first weeks in production the most advanced monitoring platform on the market can tell you nothing about whether today's load is normal.
Our working threshold is about 30 completed runs before a learned band is worth acting on. Below that, the band is either so wide that it catches nothing or so narrow that it fires on ordinary variation. What 30 runs means in calendar time is the part that catches people out.
| Load frequency | Runs needed for a usable band | Calendar time before AI monitoring works |
|---|---|---|
| Hourly | About 30 | Under two days |
| Daily | About 30 | About six weeks |
| Weekly | About 30 | About seven months |
| Monthly | About 30 | Two and a half years, so in practice never |
| Irregular or event driven | About 30 of each pattern | Unpredictable, and the band stays unreliable throughout |
The practical consequence is that every new pipeline starts on rules, whatever your platform is capable of, and monthly tables stay on rules permanently. That is not a transitional stage on the way to full automation. Month end close data, quarterly regulatory extracts and annual reference loads will still be protected by written checks in five years, because they will still not have thirty runs to learn from.
It also explains a pattern in deployments that looks like a product failure and is not. A platform lands, everything is connected, and for the first two months the monitors are quiet. The team concludes the tool is not finding anything. What is happening is that the bands are still forming, and the alerts arrive in month three all at once.
Traditional data quality work means profiling a dataset, writing validation rules against what the data is supposed to be, and cleansing what fails. That is often treated as the slow option, which understates it. Rules are the only instrument that can make a definite claim about a value, and there are things no amount of learning will ever replace.
A rule is exact within its scope and blind outside it. That combination is exactly what you want for anything with a defined correct answer, and exactly what you do not want as your only protection across a large estate. It also documents itself, which matters more than it sounds: the rule text is the control description, the test and the evidence all at once.
Rules also depend on knowing the shape of your data, which is why the work is easier on a well designed model than a sprawling one. If you are writing checks against tables you did not design, our schema design examples and the schema types behind them are a faster way in than reading the DDL. The split between what a rule can assert and what a model can only suggest maps closely onto the six dimensions of data quality: validity, uniqueness and consistency have correct answers, while timeliness and completeness are usually ranges.
These are not legacy cases waiting to be automated away. Each one has a property that makes a learned band the wrong instrument, and that property is not going to change.
Every platform in this category now describes itself as AI driven, so the phrase carries no information. These four questions separate the products that learned something from the products that added a chat box, and each one has an answer that tells you the claim is honest.
This question comes up constantly and it has no single number as an answer, because the two approaches are not accurate about the same thing.
A rule is exact within its scope. A check that says a status field must hold one of six values is right every time about those six values, and its risk is not error but coverage: it says nothing at all about the ninety other columns nobody wrote a rule for. Its failure mode is silence.
A learned monitor covers everything it is pointed at and is approximate everywhere. It has two error rates that trade against each other through a single setting: alerts that were nothing, and real problems it let through. Tighten the band and you get fewer false alerts and more misses. Loosen it and you get the reverse. Its failure mode is noise.
So the comparison to make is exact and narrow against approximate and wide, rather than accuracy against accuracy. The number worth asking any vendor for is precision on production data: of the alerts their platform raised for a real customer last quarter, what share were genuine problems. Below about half, teams start ignoring the channel, and the measured accuracy of the platform stops mattering because nobody is reading its output.
Two pieces of European law change which approach you are allowed to rely on, and neither is optional for a firm operating in the EU.
GDPR Article 5(1)(d) sets an accuracy principle: personal data must be accurate and, where necessary, kept up to date, and inaccurate data must be erased or rectified without delay. That obligation is written in the language of correct answers. Meeting it means being able to state what a field should contain and detect when it does not, which is rule work. A monitor reporting that a value looked unusual does not discharge it.
The EU AI Act, Regulation (EU) 2024/1689, adds a second obligation for anyone putting a high risk system into service. Article 10 requires training, validation and testing data sets to be examined for biases that could affect health, safety or fundamental rights, and requires those data sets to be "relevant, sufficiently representative, and to the best extent possible, free of errors and complete in view of the intended purpose". "Free of errors" is a criterion somebody has to define and evidence, so it lands on written checks rather than learned bands.
The dates matter because most competitor content is stale on them. General purpose AI model obligations applied from 2 August 2025 for models placed on the market from that date, with Commission enforcement from 2 August 2026 and models placed earlier having until 2 August 2027. The Article 50 transparency rules apply from 2 August 2026. High risk obligations apply from 2 December 2027 for standalone systems and 2 August 2028 for systems embedded in regulated products.
There is also a practical question that has nothing to do with the model. A data quality platform sitting on personal data is processing personal data, so where it runs is part of the assessment. Decube operates separate regional instances for the United States, Europe and Asia Pacific, chosen at login, and it retains only the metadata produced by its scans rather than copies of the underlying records. The exception is the Recon module, which holds unmatched rows for up to 30 days according to the retention period you set.
ITSM data has a distinctive quality profile, and it is worth naming because the AI part is the smaller half of the job.
Most ITSM quality problems are categorical and referential. Configuration items pointing at assets that were decommissioned two years ago. Tickets assigned to a support group that no longer exists. Free text category fields holding eleven spellings of the same category. Duplicate asset records created by two discovery tools. Every one of those has a correct answer that somebody can state, which makes them rule work: membership checks against the asset register, referential checks against the group table, uniqueness checks on serial numbers.
The learned monitors earn their place on the operational metrics around the tickets rather than on the tickets themselves. Ticket volume per queue, time to first response, reopen rate and backlog age have no single correct value, only a range that has held recently, so a learned band is the right instrument and a fixed threshold is guesswork. A sudden collapse in ticket volume from one integration is exactly the failure a rule would never catch, because nobody writes a rule saying we should have received at least four hundred tickets today.
So the honest answer to which AI tool reduces ITSM data quality issues is that you need both instruments pointed at different parts of the same estate, and the tool that helps is the one that runs rules and learned monitors side by side over the systems your ITSM data actually lands in, rather than inside the service desk alone.
This is the question that arrives once an agent is about to be given read access to production, and it deserves a checklist rather than a principle. Six things have to be in place, and they are in order of what breaks first when they are missing.
Items four and five are governance rather than quality work, and they are the two most often skipped. A data governance platform that holds classification, access policy and the glossary in the same place as the catalog is what makes them enforceable against an agent rather than documented in a wiki nobody reads.
Buyers comparing AI driven platforms against a rules program they already own usually want to know one thing first: does every column need its own monitor, and what does that do to the bill. Here is the answer using Decube's published pricing, checked on 5 September 2026.
Monitors attach at table and metric level rather than per column by default. Freshness, volume, schema drift and job failure are configured against a table. Only field health checks are configured per column, so those are the ones that multiply. Schema drift and job failure switch on automatically the moment a source is connected, which means they consume part of the allowance before anybody has configured anything.
| Plan | Monitors included | Data sources | Price |
|---|---|---|---|
| Starter | 1,000 | Up to 3 | 175 USD per user per month, from 21,000 a year, minimum 10 users |
| Growth | 3,000 | Up to 10 | 225 USD per user per month, from 54,000 a year, minimum 20 users |
| Enterprise | Unlimited | Unlimited | Custom, volume pricing available |
| Additional monitors | Pay as you go | n/a | 0.59 USD per monitor |
| Additional data source | n/a | One extra source | 100 USD per source per month, billed annually |
The sizing arithmetic is worth doing before you talk to anyone. Take a table with the four table level monitors, plus field health checks on five columns that matter. That is nine monitors per table. A thousand monitors therefore covers roughly 110 tables at that shape, and three thousand covers roughly 330. If your estate is four hundred tables and you want that depth on all of them, you are in Enterprise territory or paying overage at 0.59 USD a monitor, and it is better to know that before the demo than after.
The comparison against a rules program is not really about license cost. A hand written rules program covering the same four hundred tables at nine checks each is three and a half thousand checks somebody writes, reviews and then maintains through every schema change. The platform cost is visible on an invoice and the rules cost is buried in engineering time, which is why the rules option so often looks cheaper than it is.
Two conditions decide it: organizations handling large volumes and needing fast detection are better served by AI driven monitoring, and organizations with smaller datasets or heavy regulation often find rule based methods easier to implement and defend. What follows is the same judgment made specific enough to act on.
Do not choose one. Allocate. Every estate has both kinds of data in it, and the useful question is which parts get which instrument.
| Your situation | Start with | Why |
|---|---|---|
| Under about 50 tables, stable schemas | Rules | You can write and maintain the checks, and you get exact claims. Monitoring adds cost before it adds coverage. |
| Several hundred tables, growing | Learned monitors first, rules on the critical path | You cannot hand write coverage at that size. Reserve rules for the tables a regulator or a board report depends on. |
| Regulated reporting, audited controls | Rules, always, plus monitors for early warning | The control has to be a written criterion. Monitors tell you early, rules are what you show. |
| A pipeline built in the last two months | Rules | No learned band exists yet. Revisit after about 30 runs. |
| Monthly or quarterly extracts | Rules permanently | Thirty runs will take years, so a learned band never becomes reliable. |
| Preparing data for AI agents | Both, with lineage and a glossary | Agents quote whatever they read. You need coverage everywhere and exact claims on the definitions that matter. |
Two conditions decide the sequence more than anything else. If a failure in the data would be seen by a customer or a regulator, that table gets a written rule regardless of what else you deploy. If a table is one of thousands and nobody has ever written a check against it, a learned monitor is infinitely better than the nothing it has now.
Adoption is the part that gets underestimated, and the original article was right to raise it. Moving to monitored data quality is a change in who is expected to respond to an alert at nine in the morning, not just a change in tooling. Budget for the training and for the argument about ownership, because both arrive whether you planned for them or not.
Decube runs both instruments in one platform rather than making you choose, which is the design this whole comparison argues for.
On the learned side, freshness monitors learn each table's own update pattern rather than comparing it against a fixed schedule, and volume monitors use machine learning to spot unexpected changes in row counts. Thresholds can be set as an absolute number, a percentage or left on automatic, so you are not forced into a learned band where you have a real number to use. Schema drift and job failure monitors switch on automatically when a source is connected, and automated crawling refreshes the metadata behind them without anybody triggering a scan.
On the rules side, field health checks validate accuracy, completeness, validity and uniqueness at column level with null, uniqueness and pattern checks, and custom SQL monitors carry the cross table business logic only your team knows, raising an incident when the query returns rows. Group by monitors segment a check across a dimension such as region or product category, which is how you find that quality broke in one market rather than everywhere.
Around both, the data observability platform groups notifications rather than sending one per firing monitor, routes them to email, Slack or PagerDuty with severity levels, and tracks a quality scorecard over time so you can show whether trust is improving rather than asserting it. Only metadata from the scans is retained, hosting runs on AWS with redundancy across zones, and access control governs who can read or change an asset. The business glossary fixes what each term means so the checks and the reports are arguing about the same numbers.
If you want to see which of your tables would be on learned monitors and which would need written rules, that is a sensible thing to ask for in a demo, because the answer depends entirely on your load frequencies and how much history you have.
AI driven data quality solutions use machine learning to work out what normal behavior looks like for a dataset, then raise an incident when the current behavior sits outside that learned range. In practice this covers four separate things sold under one phrase: learned thresholds on operational metrics such as freshness, row volume and null rates; check suggestion from profiling results; incident triage that reads lineage and narrates what broke downstream; and automatic correction of values a model judged implausible. The first two are the ones that genuinely earn the name. The fourth is the one to question, because a system that rewrites production values without a recorded human approval is manufacturing data.
A traditional method states a condition the data must satisfy and fails the data when the condition is not met. An AI driven method learns the range the data usually sits in and flags a run outside it. The practical difference is the claim each one can make: a rule tells you a value is wrong, while a learned monitor tells you a value is unusual. Only the first is evidence. The decision rule that follows is simple. If you can write down the correct answer, write a rule. If you can only describe what normal looks like, train a monitor.
Reactive data quality means finding the problem when somebody downstream complains, which is usually after a report has been circulated or a model has been trained. Proactive means the check runs on the load rather than on the complaint, so the problem is found on the next run instead of at month end. The benefit is measured in the gap between the two: on a daily table that is typically the difference between a corrected figure and an apology. It also changes who does the work, from an analyst reconciling numbers by hand to a monitor that reports and an owner who responds.
Four, and they all come from the same property. Learned monitors attach to everything at once, so you get coverage you could never write by hand across an estate with tens of thousands of columns. They catch failure modes nobody predicted, because they are not limited to the checks somebody imagined. They scale without proportional effort, so adding a hundred tables is a connection step rather than a hundred tables of rule writing. And they detect close to the event rather than at the next manual profiling run. What they cannot do is state that a value is wrong, catch a slow drift that the band follows, or work at all on a table with no history.
By attaching monitoring to the table and the metric rather than to individually written checks, so the effort of adding a source does not grow with the number of columns in it. Freshness, volume, schema drift and job failure monitors are configured per table, and only field health checks are configured per column. The cost that does grow is the monitor count and the triage time on false alerts. On Decube, the Starter plan includes 1,000 monitors and the Growth plan 3,000, with additional monitors at 0.59 USD each. At four table level monitors plus field health on five columns, that is nine monitors a table, so 1,000 covers roughly 110 tables.
Decube runs learned monitors and written rules in one platform. On the learned side, freshness monitors learn each table's own update pattern rather than comparing it against a fixed schedule, and volume monitors use machine learning to spot unexpected changes in row counts, with thresholds set as an absolute number, a percentage or left on automatic. On the rules side, field health checks validate accuracy, completeness, validity and uniqueness at column level, and custom SQL monitors carry cross table business logic, raising an incident when the query returns rows. Schema drift and job failure monitors switch on automatically when a source is connected.
They improve coverage and weaken evidence, and both effects are real. Coverage improves because monitoring reaches tables nobody would ever have written a rule for, and because automated crawling keeps the metadata behind the checks current without a person triggering a scan. Evidence weakens because a learned band is not a control description: you can show the band, its history and the alerts it raised, but you cannot state the criterion the data had to meet, because there was not one. For anything a regulator or auditor will ask about, the criterion has to be a written rule. The governance layer that makes either useful is classification, access policy and a business glossary holding the definitions the checks are testing against.
There is no single number, because the two are not accurate about the same thing. A rule is exact within its scope and blind outside it, so its failure mode is silence: it says nothing about the columns nobody wrote a check for. A learned monitor covers everything it is pointed at and is approximate everywhere, with two error rates that trade against each other through one setting, so its failure mode is noise. The comparison to make is exact and narrow against approximate and wide. The number worth asking a vendor for is precision on production data: of the alerts raised for a real customer last quarter, what share were genuine. Below about half, teams stop reading the channel.
In five situations. Any field with a defined correct set, such as country codes, currency codes, clinical codes or product identifiers. Arithmetic across fields, such as an invoice total matching the sum of its lines or an end date falling after a start date. Regulatory and contractual thresholds, because the number comes from a document rather than from your data and an auditor will ask to see it written down. Referential integrity and uniqueness, because a primary key is either unique or the pipeline is broken. And any table with fewer than about 30 runs of history, because a learned band has nothing to learn from yet.
You can work it out from the band setting rather than taking a vendor number. A learned band drawn at the 99th percentile flags roughly one run in a hundred by construction even when the data is perfect, which on a table loading once a day is about 3.7 alerts a year from a single monitor with nothing wrong. Two thousand such monitors give 7,300 expected false alerts a year, about 29 on every working day across 250 working days. Tightening to the 99.9th percentile brings that to about 2.9 a day but tells the system to ignore every deviation smaller than a one in a thousand event. The working limit we apply is one unexplained alert per on call engineer per working day.
The question to ask is not which tools are available but which arrangement satisfies two European obligations. GDPR Article 5(1)(d) requires personal data to be accurate and kept up to date, with inaccurate data erased or rectified without delay, which is written in the language of correct answers and therefore needs rules rather than learned bands. EU AI Act Article 10 requires training, validation and testing data for high risk systems to be examined for bias and to be relevant, sufficiently representative and, to the best extent possible, free of errors and complete in view of the intended purpose. Beyond the rules themselves, a data quality platform sitting on personal data is processing personal data, so where it runs matters. Decube operates separate regional instances for the United States, Europe and Asia Pacific, selected at login, and retains only the metadata produced by its scans.
The AI part is the smaller half of the job. Most ITSM quality problems are categorical and referential: configuration items pointing at decommissioned assets, tickets assigned to groups that no longer exist, free text category fields holding many spellings of the same value, and duplicate asset records from two discovery tools. Every one of those has a correct answer, so they are rule work. Learned monitors earn their place on the operational metrics around the tickets instead, such as ticket volume per queue, time to first response, reopen rate and backlog age, which have no correct value and only a normal range. The tool that helps is one that runs both instruments over the systems the ITSM data lands in rather than inside the service desk alone.
Not per column by default. On Decube, freshness, volume, schema drift and job failure monitors are configured against a table, and only field health checks are configured per column, so those are the ones that multiply with column count. Schema drift and job failure switch on automatically when a source is connected, so they consume part of the allowance before anyone configures anything. The published plans include 1,000 monitors on Starter at 175 USD per user per month from 21,000 a year with a minimum of 10 users, 3,000 monitors on Growth at 225 USD per user per month from 54,000 a year with a minimum of 20 users, and unlimited monitors on Enterprise. Additional monitors are 0.59 USD each and an additional data source is 100 USD per source per month. At four table level monitors plus field health on five columns, a table costs about nine monitors, so 1,000 covers roughly 110 tables and 3,000 covers roughly 330.
Yes. Once a source is connected, automated crawling refreshes the metadata on a schedule, so tables and columns added after the initial connection are picked up without anybody starting a scan by hand, and schema drift monitors raise an incident when the structure of an existing table changes. Coverage gaps are handled the same way: Trusty can review a table's profiling results, find columns that no monitor is watching, propose a monitor with a recommended test type and threshold, and create it only after an explicit approval. What Decube does not do is identify commercial or revenue expansion opportunities. It is a data quality and governance platform, so expansion here means expanding monitoring and catalog coverage inside sources you already have, not finding upsell in your customer base.
Six things, in the order they break when missing. A catalog covering every source the agent can reach, not just the warehouse, or it will answer from something nobody recorded. Column level lineage, so any number it gives can be traced back to the fields that produced it. Freshness and volume monitoring on every table it reads, with the results stored next to the metadata so staleness is knowable before the answer is given. Classification and access policy bound to the agent's own identity rather than to human users. A business glossary fixing what terms such as revenue mean, so two agents do not compute the same figure two defensible ways. And an approval gate on anything that writes, recorded the same way a human change would be.

First step to AI Readiness
Table of Contents
Sneak peek from the data world.


Bring lineage, quality, governance, and AI together in one platform—so your teams and AI agents can act with confidence.
_For%20light%20backgrounds.svg)
.svg)




.webp)